Table of Contents


2025 College Free Speech Rankings

Executive Summary
For the fifth year in a row, the Foundation for Individual Rights and Expression (FIRE), a nonprofit organization committed to defending and sustaining the individual rights of all Americans to free speech and free thought, and College Pulse surveyed college undergraduates about their perceptions and experiences regarding free speech on their campuses.
This year’s survey includes 58,807 student respondents from 257 colleges and universities. Students who were enrolled in four-year degree programs were surveyed via the College Pulse mobile app and web portal from January 25 through June 17, 2024.
The College Free Speech Rankings are available online and are presented in an interactive dashboard (rankings.thefire.org) that allows for easy comparison between institutions.
Key findings:
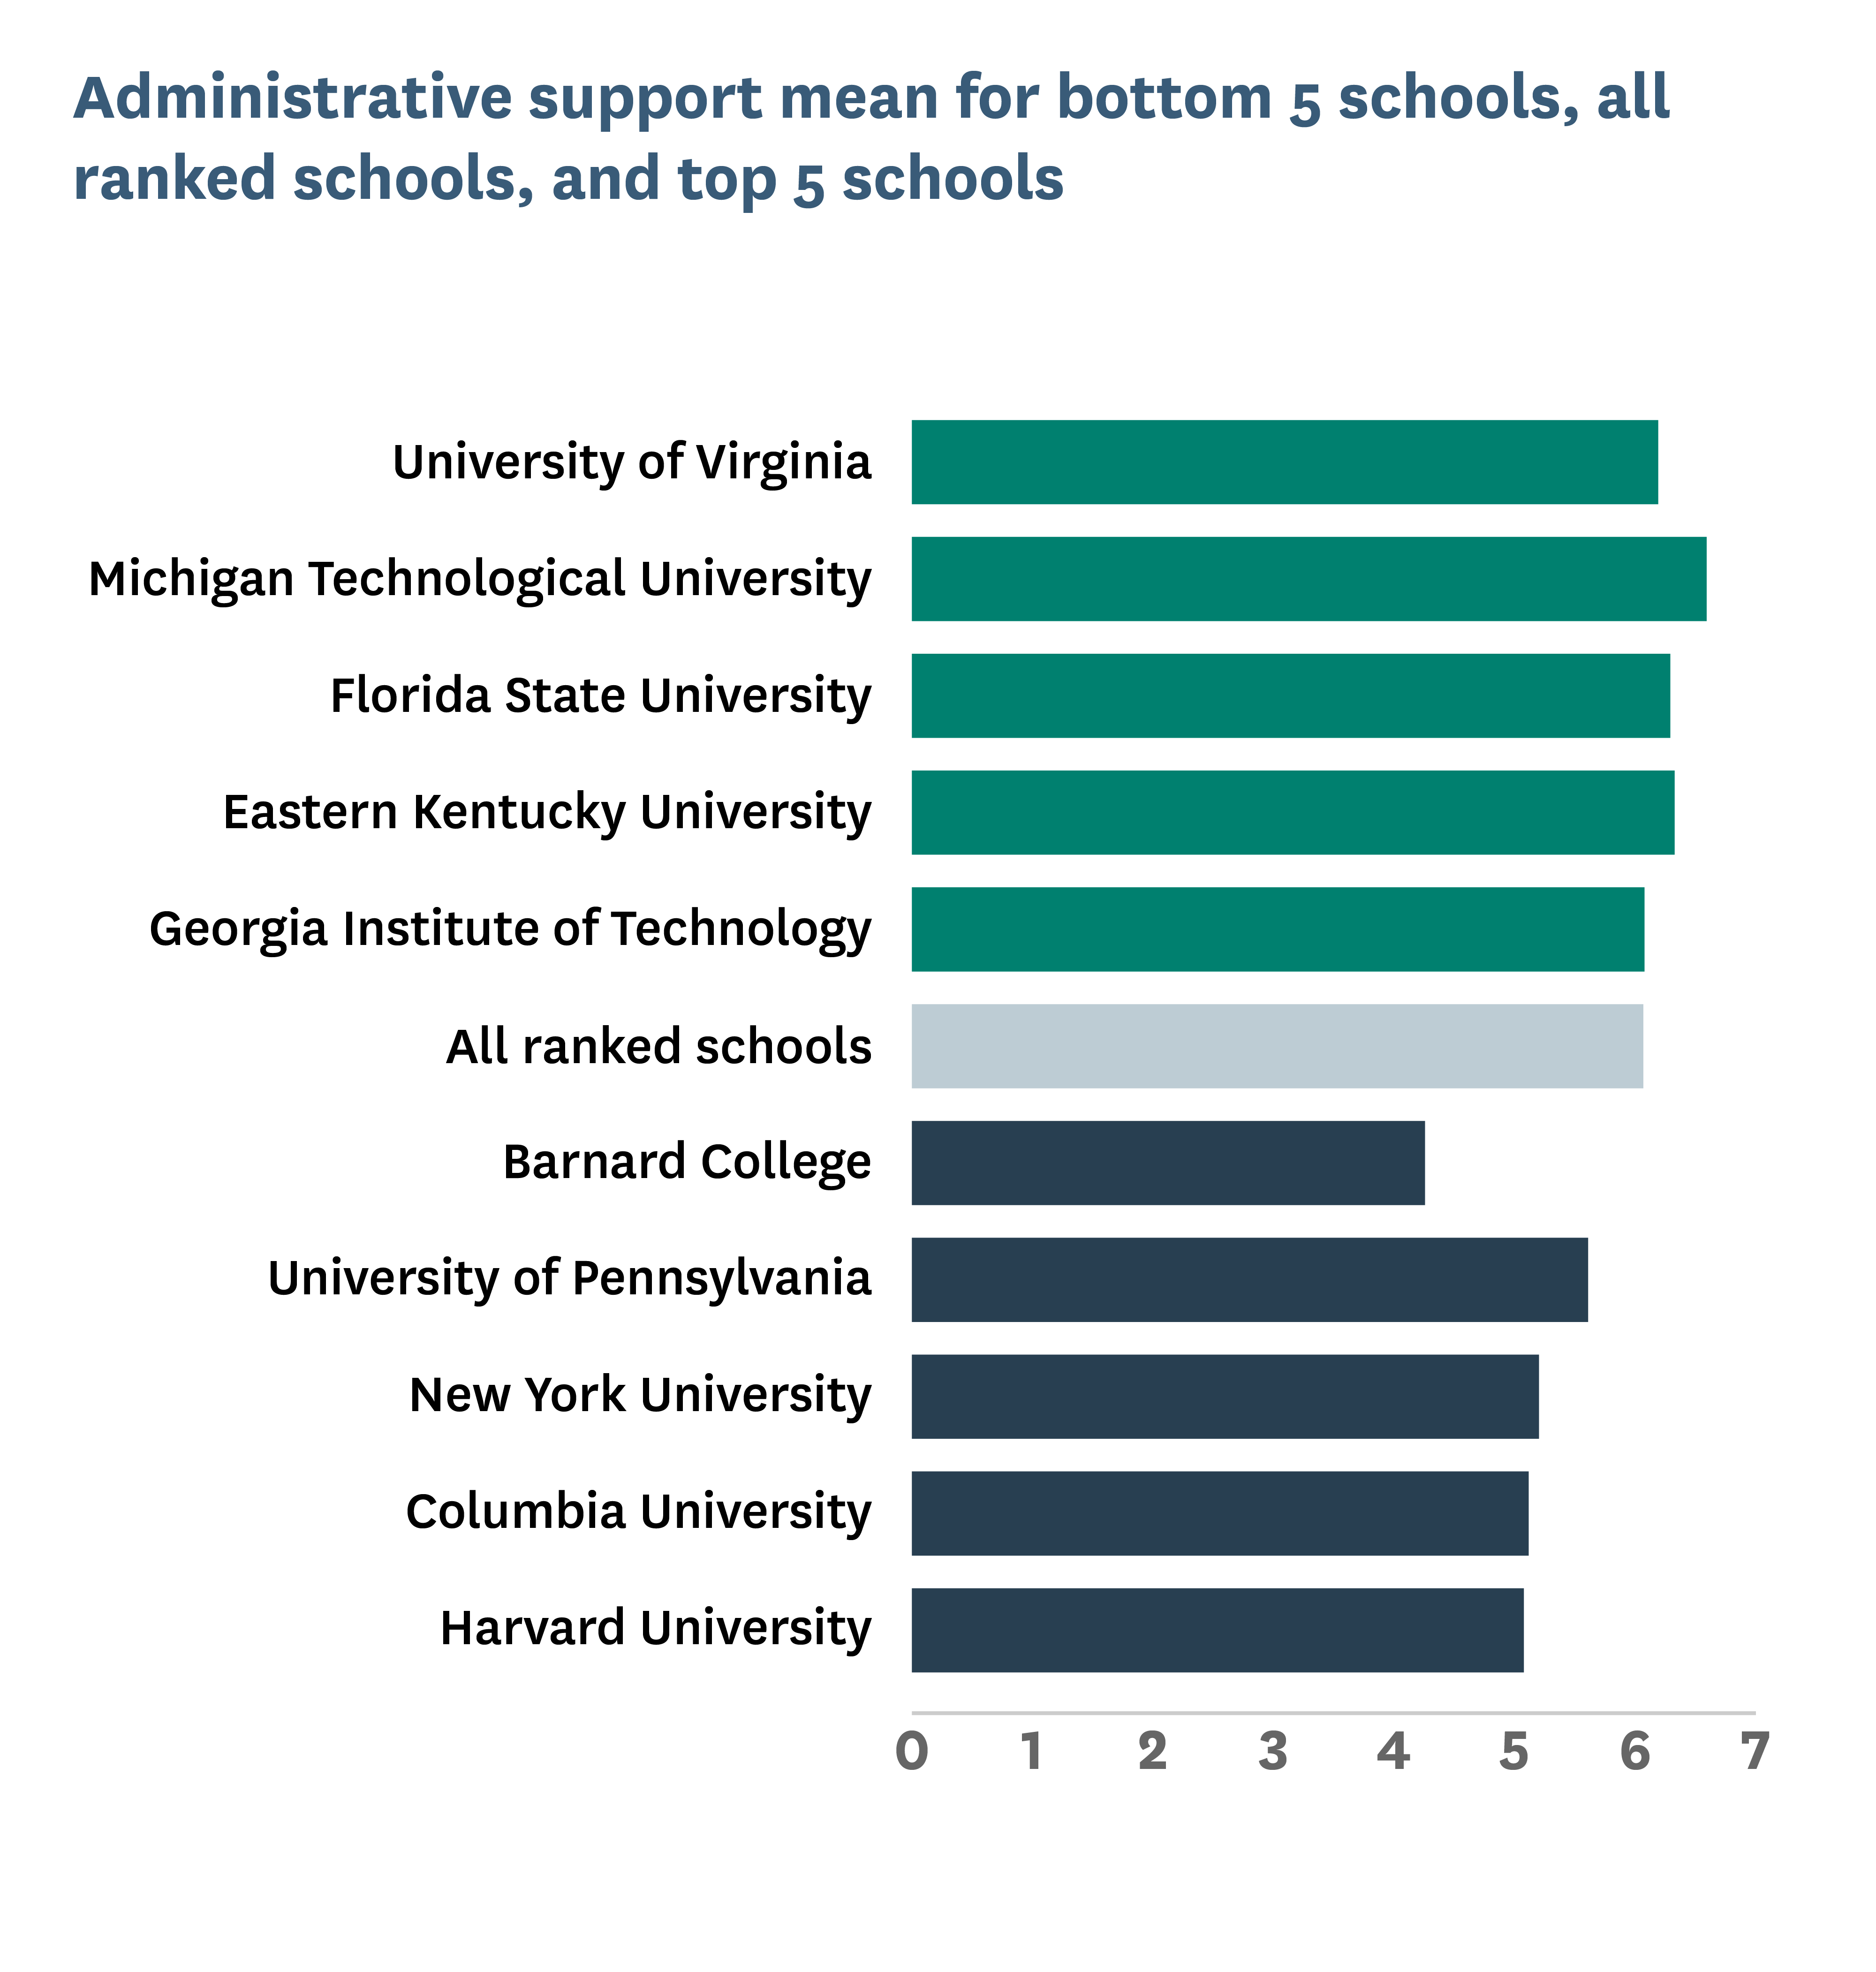
- The University of Virginia is this year’s top ranked school for free speech. Michigan Technological University, Florida State University, Eastern Kentucky University, and Georgia Tech round out the top five.
- Harvard University is this year’s bottom ranked school for free speech for the second year in a row. Joining it in the bottom three are Columbia University and New York University. All three of these schools have an “Abysmal” speech climate. The University of Pennsylvania and Barnard College round out the bottom five and each has a “Very Poor” speech climate.
- All of the bottom five schools experienced a number of controversies involving the suppression of free expression. They also received significantly lower scores than the top five schools on “Administrative Support,” “Comfort Expressing Ideas,” and “Tolerance Difference,” which measures the strength of students’ favoritism when it comes to allowing liberal or conservative speakers on campus.
- Since 2020, UVA, Michigan Tech, FSU, North Carolina State University, Oregon State University, Mississippi State University, Auburn University, George Mason University, Kansas State University, the University of Mississippi, the University of Chicago, and Claremont McKenna College have all consistently performed well in FIRE’s College Free Speech Rankings.
- A majority of students (55%) said that the Israeli-Palestinian conflict is difficult to “have an open and honest conversation about on campus,” a record high for a topic on this question in the five years we have asked it. At least 75% of students on 17 of the campuses surveyed responded this way to this question.
- The percentages of students who said shouting down a speaker, blocking other students from entering an event, and using violence to stop a campus speech is at least “rarely” acceptable all increased since last year.
- A majority of students said that six of eight hypothetical controversial campus speakers should “probably” or “definitely” not be allowed on campus.
- Student concerns about self-censorship have declined. This year, 17% of students said they feel like they cannot express their opinion on a subject at least a couple of times a week because of how students, a professor, or the administration would respond. Last year, this percentage was 20%, and in 2022 it was 22%.
About Us
About College Pulse
College Pulse is a survey research and analytics company dedicated to understanding the attitudes, preferences, and behaviors of today’s college students. College Pulse delivers custom data-driven marketing and research solutions, utilizing its unique American College Student Panel™ that includes over 850,000 college students and recent alumni from more than 1,500 two- and four-year colleges and universities in all 50 states.
For more information, visit collegepulse.com or @CollegeInsights on X.
About FIRE
The Foundation for Individual Rights and Expression (FIRE) is a nonpartisan, nonprofit organization dedicated to defending and sustaining the individual rights of all Americans to free speech and free thought. These rights include freedom of speech, freedom of association, due process, legal equality, religious liberty, and sanctity of conscience — the most essential qualities of liberty. FIRE also recognizes that colleges and universities play a vital role in preserving free thought within a free society. To this end, we place a special emphasis on defending these rights of students and faculty members on our nation’s campuses.
For more information, visit thefire.org or @thefireorg on X.
Acknowledgments and Suggested Citation
Our gratitude goes to Sean Stevens for questionnaire design, developing the scoring methodology, data analysis, and authoring this report; and to Nathan Honeycutt for support with questionnaire design, developing the scoring methodology, data analysis, data validation, and editing. We would additionally like to thank Sam Abrams for help with questionnaire design and developing the scoring methodology; Keelyn M. Gallagher, Logan Dougherty, Angela C. Erickson, Komi Frey, Sigrid Fry-Revere, Emily Nayyer, and Ryne Weiss for support with data validation; and Khalia Abner and Jackson Fleagle for designing this report.
Greg Lukianoff
President and CEO, FIRE
Suggested citation:
Stevens, S.T. (2024). 2025 College Free Speech Rankings: What Is the State of Free Speech on America’s College Campuses? The Foundation for Individual Rights and Expression.
https://www.thefire.org/research-learn/2025-college-free-speech-rankings
Overview
In 2020, in collaboration with College Pulse and RealClearEducation, FIRE launched a first-of-its-kind tool to help high school students and their parents identify which colleges promote and protect the free exchange of ideas: the College Free Speech Rankings. The response to the rankings report and corresponding online tool was overwhelmingly positive.
We heard from prospective students how helpful it is to see what a large number of current students reported about the campus climate for open discussion and inquiry, allowing for comparisons between colleges. We also heard from colleges and universities that the rankings helped them better understand their campus climate in order to improve it. Similarly, professors and staff became better equipped to understand which topics students on their campuses find difficult to discuss.
Each year, we have increased the number of campuses surveyed — from 55 in 2020 to 257 this year. In these five years, we have obtained survey responses from more than 200,000 undergraduates, including 58,807 this year. As in previous years, the College Free Speech Rankings dashboard (rankings.thefire.org) is available on the College Pulse website and the FIRE website. The dashboard offers a unique tool to compare schools’ free speech rankings and to explore other factors that students find important in a college or university, such as cost and proximity to home.

2025 College Free Speech Rankings expose threats to First Amendment rights on campus
Press Release
University of Virginia takes the top spot, while Harvard, Columbia, and NYU share an “Abysmal” free speech status.
The rankings offer students, parents, professors, administrators, and any other interested constituency unrivaled insight into undergraduate attitudes about and experiences with free expression on their college campuses. It also allows viewers to compare different colleges’ culture for free expression. Prospective students and their parents, as well as students considering transferring to another college, can use the rankings to assess and compare the speech climates at the schools they are considering attending. Current college students, professors, and administrators can use the rankings to better understand their own campus climate and see how it compares to that of others across the country.
The data examined in this report provide a wealth of information about college student attitudes about free speech and the state of free speech on campuses across America. Do students feel comfortable speaking out about topics about which they are passionate, even when they have a minority viewpoint, in the classroom or in common campus areas? Are they open to hearing from challenging and sometimes controversial speakers? Are they open to allowing speakers to visit campus without facing a heckler’s veto — or worse?
The body of this report sheds light on the answers to these questions, among others, and contains three sections:
- First, it presents the core findings of the 2025 College Free Speech Rankings.
- It then presents a deeper analysis of some of the campuses impacted by the encampments that students set up during the spring 2024 semester to protest Israel’s military response to Hamas’ October 7, 2023, attack.
- The final section of this report presents analyses of college students’ free speech attitudes and experiences.
The analyses of the encampment protests are buttressed by an accompanying report detailing the results of a separate survey conducted on 30 campuses after the encampment protests began. This report was released in conjunction with this year’s rankings.
2025 College Free Speech Rankings
A lot has happened since FIRE released the 2024 College Free Speech Rankings last September. Most significantly, Hamas’ attack on Israel on October 7, 2023, and the subsequent war in Gaza sent shockwaves through American college and university campuses.
Campus deplatforming attempts occurred at record levels, and protesters attempted to disrupt events with increasing frequency — and succeeded with increasing regularity.[1] Students, student groups, and faculty who expressed pro-Israeli or pro-Palestinian sentiment were targeted for sanction by their peers, administrators, and elected officials.[2] University presidents testified in front of the House of Representatives on matters related to speech and protest on campus, and some subsequently resigned.[3]
This past spring, students on campuses across the country set up encampments to protest Israel’s military operations in Gaza, demanding that colleges and universities divest from companies who work with Israel or its military.[4] Members of the general public have not looked fondly on these protests: Three-quarters of them said that students who participate in the encampments should be disciplined in some way.[5]
Given all of this, it is not surprising that American confidence in higher education is at a record low.[6]
In response to the encampment protests, FIRE and College Pulse reopened this year’s rankings survey on any campus with an encampment. This allowed us to collect survey data from students while the encampments were taking place.[7] In comparing this data to data from the same campus before an encampment started, we were able to measure changes in the campus speech climate in real time. This means that this year’s rankings provide a treasure trove of data on the evolving state of free expression at American colleges and universities.
As you will see, a college’s scores often reflect its response to the events of the past year.
The Best and Worst Colleges for Free Speech
This year the University of Virginia is the top ranked school for free speech with an overall score of 73.41. Michigan Technological University, last year’s top school, ranks second overall with a score of 73.15. Florida State University, last year’s fifth-place school, ranks third with a score of 72.46. Each of the top three schools have a “Good” speech climate and actively defended free expression during campus speech controversies — UVA and Michigan Tech did so on multiple occasions. None of the three schools have a perfect record, but their actions to uphold free speech contributed to their position in the 2025 College Free Speech Rankings.
FIRE has surveyed and ranked all of the top three schools multiple times over the five years that we have conducted the rankings. They consistently perform well. We surveyed UVA all five years: It achieved a ranking of 6 (twice), 22, and 24 before earning the top spot this year. We surveyed FSU four times: It achieved a ranking of 5 (twice) and 15 prior to earning the third slot this year. We only surveyed Michigan Tech twice: It came in second place this year after being last year’s top school.
Eastern Kentucky University, with a score of 69.60, and Georgia Institute of Technology, with a score of 69.39, round out the top five. Both schools have “Above Average” speech climates. Like Michigan Tech, EKU made its rankings debut last year and also did well with a ranking of 15.
All of the top five schools are state universities. Their average score is 71.60.
At the other end of the rankings, Harvard University came in last for the second year in a row and again obtained the lowest score possible: 0.00. This year, however, Harvard has company. Columbia University ranks 250, also with an overall score of 0.00.[8] New York University, with a score of 3.33, ranks 249. All three of these schools have “Abysmal” speech climates. The University of Pennsylvania, with a score of 12.50, and Barnard College, with a score of 15.62, round out the bottom five. Both of these schools have a “Very Poor” speech climate.

In the aftermath of Claudine Gay's resignation, here's how Harvard can reform itself
News
With the loss of its president, America’s worst college for free speech is at another crossroads.
All of the bottom five schools are private institutions. Their average score is 6.29.
Why do the schools in the bottom five do so poorly? For starters, they each experienced a number of controversies in which expression was censored, suppressed, or shouted down. For instance, since 2020 we documented 20 speech controversies at Harvard that resulted in a deplatforming, a scholar sanction, a student sanction, or an attempted disruption of an event. In the same time frame, we documented 14 such incidents at Columbia, 12 at NYU, 10 at Penn, and 7 at Barnard. These incidents collectively resulted in 13 deplatformings, nine attempted disruptions, 23 scholar sanctions, and 18 student sanctions. During the same time period, we documented only five instances of the bottom five schools vigorously defending free speech.[9]
In contrast, since 2020 the top five schools have issued a total of two scholar sanctions and two student sanctions. During the same time period, we documented no deplatformings or attempted disruptions and seven instances of a top-five school vigorously defending free speech.
The outcomes of these speech controversies may also help explain why the bottom five schools received some of the worst “Administrative Support” scores. On “Administrative Support,” NYU ranks 245, Columbia ranks 247, Harvard ranks 250, and Barnard ranks 251 — dead last. Barnard’s score on “Administrative Support” is almost two full standard deviations below that of Harvard, the second-worst performing school on this component. With a ranking of 219 on the same component, Penn does somewhat better than its bottom-five counterparts, but it still does not do well compared to most other schools on the list. The bottom five schools have an average “Administrative Support” ranking of 242, suggesting that students who attend these schools do not think their administration strongly supports freedom of speech.
The top five schools received considerably higher “Administrative Support” scores than the bottom five schools.[10] Michigan Tech does particularly well, ranking 15. The remaining top five schools’ rankings on this component range from 62 (EKU) to 124 (Georgia Tech). The top five schools have an average “Administrative Support” ranking of 75, and all five scored at least two standard deviations above the scores of four of the bottom five schools — Penn is the lone exception.
The top five schools also received considerably higher “Comfort Expressing Ideas” and “Tolerance Difference” scores than the bottom five schools.[11]
When it comes to comfort, the top five schools have an average ranking of 111 — led by EKU at 37 and FSU at 44. The bottom five schools, however, have an average ranking of 227. On “Comfort Expressing Ideas,” the top ranked bottom-five school is NYU at 173. Columbia ranks 234, Harvard ranks 235, Penn ranks 245, and Barnard ranks second to last at 250. This indicates that students at the top five schools are significantly more comfortable than students at the bottom five schools expressing their views on controversial political topics on campus in different contexts — such as during a class discussion or during a conversation in the dining hall or lounge.
In terms of political tolerance, students at the bottom five schools are considerably more willing than students at the top five schools to allow controversial liberal speakers on campus. They are considerably less willing to allow controversial conservative speakers on campus.
The bottom five schools have an average “Tolerance Difference” ranking of 183. Among the bottom five schools, Harvard received the highest “Tolerance Difference” ranking: 131. This ranking is better than that of one of the top five schools, UVA, which received a ranking of 150. However, the remaining bottom five schools all received rankings worse than 150. Penn ranks 172, NYU ranks 188, Columbia ranks 192, and Barnard ranks 232.
In contrast, the top five schools have an average “Tolerance Difference” ranking of 70, and UVA is the only top-five school that does not rank in the top 100. Michigan Tech ranks 9, EKU ranks 33, FSU ranks 68, and Georgia Tech ranks 89. These findings suggest that students at the top five schools are more politically tolerant than their counterparts at the bottom five schools. This conclusion is further supported by the prevalence of speech suppression on the bottom five campuses — as evidenced by the number of deplatformings, attempted disruptions, sanctioned scholars, and sanctioned students.
In sum, some clear differences exist between the top five and the bottom five schools. The top five schools are reluctant to sanction expression during a speech controversy. As compared to students at the bottom five schools, students at the top five schools believe their administration is more supportive of freedom of speech, feel more comfortable expressing their views on controversial political topics on campus, and appear to exhibit less bias against campus speakers based on the speaker’s political views.
As noted, FIRE has surveyed UVA, Michigan Tech, FSU, and EKU multiple times, and they have each consistently performed well in the rankings. North Carolina State University, Oregon State University, Mississippi State University, Auburn University, George Mason University, Kansas State University, Claremont McKenna College, the University of Chicago, and the University of Mississippi have also performed well year after year.
At the other end of the spectrum, Columbia, Harvard, and Penn have consistently performed poorly over the years. This list also includes Fordham University, Georgetown University, Marquette University, Rensselaer Polytechnic Institute, and the University of Texas at Austin. Harvard, Georgetown, and RPI have each received FIRE’s Lifetime Censorship Award.[12]
The rankings, overall score, and speech climate of the top 25 colleges are presented below. Scores are standardized and can range from 0-100.
The top 25 include 24 schools that received FIRE’s “green light” rating — and one, Northeastern Illinois University, that received FIRE’s “yellow light” rating — for their speech-related policies. The full rankings for all 257 schools and scoring methodology are available in the Appendix, as well as on the College Free Speech Rankings dashboard, the College Pulse website, and the FIRE website.[13]
2025 College Free Speech Rankings
| Rank | School | Overall Score | Speech Climate | Spotlight Rating |
|---|---|---|---|---|
| 1 | University of Virginia | 73.41 | Good | Green |
| 2 | Michigan Technological University | 73.15 | Good | Green |
| 3 | Florida State University | 72.46 | Good | Green |
| 4 | Eastern Kentucky University | 69.60 | Above Average | Green |
| 5 | Georgia Institute of Technology | 69.39 | Above Average | Green |
| 6 | Claremont McKenna College | 69.15 | Above Average | Green |
| 7 | North Carolina State University | 68.44 | Above Average | Green |
| 8 | Oregon State University | 67.26 | Above Average | Green |
| 9 | University of North Carolina, Charlotte | 66.51 | Above Average | Green |
| 10 | Mississippi State University | 66.14 | Above Average | Green |
| 11 | Auburn University | 65.76 | Above Average | Green |
| 12 | College of William & Mary | 65.23 | Above Average | Green |
| 13 | East Carolina University | 64.64 | Above Average | Green |
| 14 | Arizona State University | 64.48 | Above Average | Green |
| 15 | Northeastern Illinois University | 64.19 | Above Average | Yellow |
| 16 | George Mason University | 63.92 | Above Average | Green |
| 17 | University of South Florida | 63.40 | Above Average | Green |
| 18 | Kansas State University | 63.16 | Above Average | Green |
| 19 | University of Louisville | 62.91 | Above Average | Green |
| 20 | University of Mississippi | 62.41 | Above Average | Green |
| 21 | Clemson University | 60.80 | Above Average | Green |
| 22 | University of North Carolina, Greensboro | 60.76 | Above Average | Green |
| 23 | University of Tulsa | 60.74 | Above Average | Green |
| 24 | Appalachian State University | 60.43 | Above Average | Green |
| 25 | University of Arizona | 60.23 | Above Average | Green |
| 26 | Colorado School of Mines | 59.90 | Slightly Above Average | Yellow |
| 27 | Duke University | 59.72 | Slightly Above Average | Green |
| 28 | Northern Arizona University | 59.21 | Slightly Above Average | Green |
| 29 | University of Colorado, Boulder | 58.87 | Slightly Above Average | Green |
| 30 | Purdue University | 58.42 | Slightly Above Average | Green |
| 31 | New Mexico State University | 57.90 | Slightly Above Average | Yellow |
| 32 | Virginia Commonwealth University | 57.67 | Slightly Above Average | Green |
| 33 | Washington and Lee University | 57.06 | Slightly Above Average | Yellow |
| 34 | University of South Carolina | 56.81 | Slightly Above Average | Green |
| 35 | Florida International University | 56.43 | Slightly Above Average | Yellow |
| 36 | DePauw University | 56.36 | Slightly Above Average | Green |
| 37 | James Madison University | 56.26 | Slightly Above Average | Yellow |
| 38 | Wayne State University | 56.13 | Slightly Above Average | Yellow |
| 39 | University of Maryland | 55.72 | Slightly Above Average | Green |
| 40 | University of Alabama, Birmingham | 55.62 | Slightly Above Average | Yellow |
| 41 | Carnegie Mellon University | 55.56 | Slightly Above Average | Yellow |
| 42 | University of Hawaii | 55.56 | Slightly Above Average | Yellow |
| 43 | University of Chicago | 55.20 | Slightly Above Average | Green |
| 44 | Kent State University | 55.07 | Slightly Above Average | Yellow |
| 45 | Georgia State University | 54.59 | Average | Yellow |
| 46 | Worcester Polytechnic Institute | 54.55 | Average | Yellow |
| 47 | University of Texas, El Paso | 54.54 | Average | Yellow |
| 48 | University of Memphis | 54.05 | Average | Yellow |
| 49 | University of Alabama, Huntsville | 53.88 | Average | Yellow |
| 50 | Wright State University | 53.77 | Average | Yellow |
| 51 | University of Oklahoma | 53.52 | Average | Yellow |
| 52 | Oklahoma State University | 53.45 | Average | Yellow |
| 53 | Towson University | 53.41 | Average | Yellow |
| 54 | University of Wisconsin, Milwaukee | 53.38 | Average | Yellow |
| 55 | University of Missouri, St. Louis | 53.20 | Average | Yellow |
| 56 | University of Missouri, Kansas City | 53.18 | Average | Yellow |
| 57 | Miami University | 53.03 | Average | Yellow |
| 58 | Arkansas State University | 52.91 | Average | Yellow |
| 59 | University of New Hampshire | 52.86 | Average | Green |
| 60 | Swarthmore College | 52.86 | Average | Yellow |
| 61 | Clarkson University | 52.82 | Average | Red |
| 62 | University of North Carolina, Chapel Hill | 52.73 | Average | Green |
| 63 | University of Idaho | 52.73 | Average | Yellow |
| 64 | Ohio University | 52.71 | Average | Yellow |
| 65 | Temple University | 52.70 | Average | Yellow |
| 66 | University of Toledo | 52.45 | Average | Yellow |
| 67 | Denison University | 52.42 | Average | Yellow |
| 68 | Texas Tech University | 52.31 | Average | Yellow |
| 69 | University of Alabama, Tuscaloosa | 51.94 | Average | Yellow |
| 70 | Rowan University | 51.84 | Average | Yellow |
| 71 | San Diego State University | 51.68 | Average | Yellow |
| 72 | University of Delaware | 51.60 | Average | Yellow |
| 73 | Bard College | 51.56 | Average | Yellow |
| 74 | University of California, Irvine | 51.44 | Average | Yellow |
| 75 | Utah State University | 51.43 | Average | Red |
| 76 | Texas State University | 51.37 | Average | Yellow |
| 77 | University of Illinois, Chicago | 51.14 | Average | Yellow |
| 78 | Wake Forest University | 51.11 | Average | Yellow |
| 79 | University of California, Merced | 51.01 | Average | Yellow |
| 80 | Occidental College | 50.89 | Average | Yellow |
| 81 | Boise State University | 50.86 | Average | Yellow |
| 82 | Missouri State University | 50.80 | Average | Yellow |
| 83 | Knox College | 50.78 | Average | Yellow |
| 84 | Montana State University | 50.74 | Average | Yellow |
| 85 | Carleton College | 50.73 | Average | Yellow |
| 86 | California State University, Los Angeles | 50.65 | Average | Yellow |
| 87 | Iowa State University | 50.63 | Average | Yellow |
| 88 | University of Texas, San Antonio | 50.60 | Average | Yellow |
| 89 | Eastern Michigan University | 50.54 | Average | Yellow |
| 90 | Kenyon College | 50.54 | Average | Yellow |
| 91 | Colorado State University | 50.51 | Average | Yellow |
| 92 | Trinity College | 50.51 | Average | Yellow |
| 93 | University of California, Santa Barbara | 50.43 | Average | Yellow |
| 94 | New Jersey Institute of Technology | 50.34 | Average | Yellow |
| 95 | University of Tennessee | 50.31 | Average | Green |
| 96 | Hamilton College | 50.30 | Average | Yellow |
| 97 | West Virginia University | 50.28 | Average | Yellow |
| 98 | University of Colorado, Denver | 50.26 | Average | Yellow |
| 99 | Bowdoin College | 50.15 | Average | Yellow |
| 100 | Illinois State University | 49.92 | Average | Yellow |
| 101 | University of Wisconsin, Eau Claire | 49.87 | Average | Yellow |
| 102 | University of Minnesota | 49.87 | Average | Yellow |
| 103 | University of Maine | 49.87 | Average | Yellow |
| 104 | University of Illinois, Urbana-Champaign | 49.86 | Average | Yellow |
| 105 | University of Rhode Island | 49.59 | Average | Yellow |
| 106 | University of Massachusetts | 49.58 | Average | Yellow |
| 107 | University of Arkansas | 49.29 | Average | Yellow |
| 108 | Binghamton University | 49.19 | Average | Yellow |
| 109 | University of Nevada, Las Vegas | 49.08 | Average | Yellow |
| 110 | Colby College | 49.01 | Average | Yellow |
| 111 | California Institute of Technology | 48.81 | Average | Red |
| 112 | Lehigh University | 48.69 | Average | Red |
| 113 | University of California, Riverside | 48.68 | Average | Yellow |
| 114 | Dakota State University | 48.57 | Average | Red |
| 115 | Oberlin College | 48.51 | Average | Yellow |
| 116 | Virginia Tech University | 48.50 | Average | Yellow |
| 117 | University of Nevada, Reno | 48.49 | Average | Yellow |
| 118 | Franklin and Marshall College | 48.44 | Average | Yellow |
| 119 | Johns Hopkins University | 48.31 | Average | Yellow |
| 120 | California Polytechnic State University | 48.17 | Average | Yellow |
| 121 | University of Wyoming | 47.95 | Average | Red |
| 122 | University of California, Santa Cruz | 47.87 | Average | Yellow |
| 123 | Scripps College | 47.66 | Average | Yellow |
| 124 | Amherst College | 47.65 | Average | Yellow |
| 125 | North Dakota State University | 47.39 | Average | Yellow |
| 126 | Bucknell University | 47.38 | Average | Yellow |
| 127 | Davidson College | 47.37 | Average | Yellow |
| 128 | Illinois Institute of Technology | 47.30 | Average | Red |
| 129 | University of Missouri, Columbia | 47.24 | Average | Yellow |
| 130 | Texas A&M University | 47.10 | Average | Green |
| 131 | University of Alaska | 46.98 | Average | Red |
| 132 | Stony Brook University | 46.96 | Average | Yellow |
| 133 | University of California, San Diego | 46.82 | Average | Yellow |
| 134 | Santa Clara University | 46.82 | Average | Red |
| 135 | Stevens Institute of Technology | 46.78 | Average | Red |
| 136 | Southern Methodist University | 46.73 | Average | Yellow |
| 137 | University of Rochester | 46.48 | Average | Yellow |
| 138 | Southern Illinois University, Carbondale | 46.24 | Average | Red |
| 139 | Washington State University | 46.23 | Average | Yellow |
| 140 | Vanderbilt University | 45.96 | Average | Yellow |
| 141 | University of Georgia | 45.62 | Average | Yellow |
| 142 | Wellesley College | 45.60 | Average | Yellow |
| 143 | University of Texas, Arlington | 45.35 | Average | Yellow |
| 144 | Creighton University | 45.16 | Average | Red |
| 145 | Drexel University | 45.15 | Average | Red |
| 146 | Berea College | 45.08 | Average | Yellow |
| 147 | Bates College | 45.05 | Average | Red |
| 148 | Bowling Green State University | 44.98 | Slightly Below Average | Yellow |
| 149 | University of Nebraska | 44.98 | Slightly Below Average | Yellow |
| 150 | University of San Francisco | 44.80 | Slightly Below Average | Red |
| 151 | Skidmore College | 44.72 | Slightly Below Average | Yellow |
| 152 | Wesleyan University | 44.29 | Slightly Below Average | Yellow |
| 153 | Harvey Mudd College | 44.18 | Slightly Below Average | Yellow |
| 154 | Emory University | 44.07 | Slightly Below Average | Green |
| 155 | Yale University | 44.04 | Slightly Below Average | Yellow |
| 156 | Williams College | 43.97 | Slightly Below Average | Yellow |
| 157 | California State University, Fresno | 43.89 | Slightly Below Average | Red |
| 158 | Wheaton College | 43.84 | Slightly Below Average | Yellow |
| 159 | University of Cincinnati | 43.66 | Slightly Below Average | Yellow |
| 160 | Vassar College | 43.61 | Slightly Below Average | Yellow |
| 161 | George Washington University | 43.55 | Slightly Below Average | Yellow |
| 162 | Boston University | 43.49 | Slightly Below Average | Yellow |
| 163 | Montclair State University | 43.34 | Slightly Below Average | Yellow |
| 164 | Massachusetts Institute of Technology | 43.32 | Slightly Below Average | Yellow |
| 165 | Rice University | 43.20 | Slightly Below Average | Red |
| 166 | University of Texas, Dallas | 43.06 | Slightly Below Average | Red |
| 167 | University of Notre Dame | 43.04 | Slightly Below Average | Red |
| 168 | San Jose State University | 42.96 | Slightly Below Average | Yellow |
| 169 | University at Buffalo | 42.82 | Slightly Below Average | Yellow |
| 170 | University of Florida | 42.78 | Slightly Below Average | Green |
| 171 | Southern Illinois University, Edwardsville | 42.77 | Slightly Below Average | Red |
| 172 | University of Kentucky | 42.62 | Slightly Below Average | Yellow |
| 173 | Rensselaer Polytechnic Institute | 42.50 | Slightly Below Average | Red |
| 174 | Ohio State University | 42.34 | Slightly Below Average | Yellow |
| 175 | Michigan State University | 42.18 | Slightly Below Average | Yellow |
| 176 | Colorado College | 42.13 | Slightly Below Average | Yellow |
| 177 | Middlebury College | 42.12 | Slightly Below Average | Red |
| 178 | Northeastern University | 42.08 | Slightly Below Average | Red |
| 179 | Smith College | 41.97 | Slightly Below Average | Yellow |
| 180 | Pitzer College | 41.76 | Slightly Below Average | Yellow |
| 181 | Chapman University | 41.68 | Slightly Below Average | Red |
| 182 | Tufts University | 41.60 | Slightly Below Average | Red |
| 183 | University of Central Florida | 41.47 | Slightly Below Average | Yellow |
| 184 | Macalester College | 41.20 | Slightly Below Average | Red |
| 185 | Villanova University | 41.12 | Slightly Below Average | Red |
| 186 | University of Michigan | 41.11 | Slightly Below Average | Yellow |
| 187 | Washington University in St Louis | 40.94 | Slightly Below Average | Yellow |
| 188 | University of Miami | 40.76 | Slightly Below Average | Red |
| 189 | Boston College | 40.76 | Slightly Below Average | Red |
| 190 | Haverford College | 40.74 | Slightly Below Average | Red |
| 191 | Grinnell College | 40.58 | Slightly Below Average | Red |
| 192 | University of Dayton | 40.41 | Slightly Below Average | Red |
| 193 | Western Michigan University | 40.12 | Slightly Below Average | Red |
| 194 | Portland State University | 40.08 | Slightly Below Average | Red |
| 195 | Case Western Reserve University | 39.90 | Below Average | Red |
| 196 | University of Connecticut | 39.68 | Below Average | Yellow |
| 197 | Gettysburg College | 39.64 | Below Average | Red |
| 198 | Rutgers University | 39.38 | Below Average | Yellow |
| 199 | Louisiana State University | 39.26 | Below Average | Red |
| 200 | University of Oregon | 39.22 | Below Average | Yellow |
| 201 | DePaul University | 38.89 | Below Average | Yellow |
| 202 | Connecticut College | 38.89 | Below Average | Red |
| 203 | University of Kansas | 38.76 | Below Average | Yellow |
| 204 | College of Charleston | 38.74 | Below Average | Yellow |
| 205 | University of North Texas | 38.60 | Below Average | Yellow |
| 206 | SUNY College at Geneseo | 38.13 | Below Average | Yellow |
| 207 | Mount Holyoke College | 38.11 | Below Average | Red |
| 208 | University of Pittsburgh | 38.04 | Below Average | Yellow |
| 209 | Loyola University, Chicago | 38.03 | Below Average | Red |
| 210 | University of Denver | 37.99 | Below Average | Yellow |
| 211 | Colgate University | 37.92 | Below Average | Red |
| 212 | SUNY at Albany | 37.66 | Below Average | Yellow |
| 213 | Lafayette College | 37.54 | Below Average | Red |
| 214 | Clark University | 37.08 | Below Average | Red |
| 215 | Cornell University | 36.49 | Below Average | Yellow |
| 216 | University of Iowa | 36.23 | Below Average | Yellow |
| 217 | Tulane University | 35.96 | Below Average | Yellow |
| 218 | Stanford University | 35.49 | Below Average | Yellow |
| 219 | University of New Mexico | 35.46 | Below Average | Yellow |
| 220 | University of California, Los Angeles | 35.07 | Below Average | Green |
| 221 | Furman University | 34.74 | Below Average | Red |
| 222 | Duquesne University | 34.54 | Below Average | Yellow |
| 223 | Princeton University | 34.49 | Below Average | Red |
| 224 | Dartmouth College | 34.37 | Below Average | Yellow |
| 225 | University of California, Berkeley | 34.22 | Below Average | Yellow |
| 226 | University of Washington | 34.14 | Below Average | Red |
| 227 | University of Wisconsin, Madison | 33.96 | Below Average | Yellow |
| 228 | Pennsylvania State University | 33.18 | Below Average | Yellow |
| 229 | Brown University | 33.13 | Below Average | Yellow |
| 230 | University of Houston | 32.36 | Below Average | Yellow |
| 231 | Brandeis University | 31.96 | Below Average | Yellow |
| 232 | Central Michigan University | 31.45 | Below Average | Yellow |
| 233 | University of Vermont | 31.35 | Below Average | Yellow |
| 234 | Fordham University | 30.97 | Below Average | Red |
| 235 | Marquette University | 30.96 | Below Average | Red |
| 236 | Howard University | 29.77 | Poor | Red |
| 237 | American University | 29.31 | Poor | Yellow |
| 238 | Northwestern University | 29.04 | Poor | Red |
| 239 | University of California, Davis | 26.72 | Poor | Yellow |
| 240 | Georgetown University | 25.96 | Poor | Red |
| 241 | University of Utah | 25.46 | Poor | Yellow |
| 242 | Pomona College | 25.42 | Poor | Yellow |
| 243 | Indiana University | 24.67 | Poor | Yellow |
| 244 | University of Texas, Austin | 23.39 | Poor | Yellow |
| 245 | University of Southern California | 19.79 | Very Poor | Red |
| 246 | Syracuse University | 17.24 | Very Poor | Yellow |
| 247 | Barnard College | 15.62 | Very Poor | Yellow |
| 248 | University of Pennsylvania | 12.50 | Very Poor | Yellow |
| 249 | New York University | 3.33 | Abysmal | Yellow |
| 250 | Columbia University | -0.58 | Abysmal | Yellow |
| 251 | Harvard University | -21.58 | Abysmal | Yellow |
| Warning | Baylor University | 24.96 | Warning | Warning |
| Warning | Brigham Young University | 26.27 | Warning | Warning |
| Warning | Hillsdale College | 46.73 | Warning | Warning |
| Warning | Liberty University | 34.91 | Warning | Warning |
| Warning | Pepperdine University | 29.64 | Warning | Warning |
| Warning | Saint Louis University | 17.49 | Warning | Warning |
Risers and Fallers
Each year some students graduate, others transfer, and a new cohort of students enrolls in college. This cohort replacement makes it possible for the speech climate on a campus to change quickly. This year a handful of schools noticeably rose in the rankings. Others precipitously fell. Below, we briefly review a handful of these schools and note the reasons for their rise or fall.
Claremont McKenna College: After falling from the top 10 to 73 last year, Claremont McKenna — which, like Florida State, we have surveyed four times — returns to its familiar spot in the top 10 with a ranking of 6.
Claremont McKenna’s performance this year is notable. It ranks:
- 1 on “Comfort Expressing Ideas.”
- 3 on “Mean Tolerance,”
- 7 on “Tolerance for Controversial Conservative Speakers.”
- 8 on “Tolerance for Controversial Liberal Speakers.”
- 9 on “Administrative Support.”
- 25 on “Self-Censorship.”
- 44 on “Openness.”
These scores suggest that students at Claremont McKenna are comfortable expressing their views on a number of controversial political topics and doing so in a number of different contexts on campus, that they tolerate controversial speakers on campus, and that they believe their administration is committed to the First Amendment.
Claremont McKenna ranks 100 on “Disruptive Conduct” and 148 on “Tolerance Difference.” Its “Tolerance Difference” ranking suggests that even though most students at Claremont McKenna are tolerant of controversial speakers whether they are liberal or conservative, they are more likely to support allowing a controversial liberal speaker on campus.
University of Chicago: UChicago took either the first or second spot in each of the first three years of the rankings. Last year, it dropped to a ranking of 13, largely due to the administration’s decision to deny official recognition to a Turning Point USA club because the members "hadn't proved that there was interest in the group" and the club would be "too similar to College Republicans."
This year, UChicago’s ranking dropped again, this time to 43. This decline is primarily due to two incidents that occurred after Hamas’ October 7, 2023, attack on Israel. In one instance, medical students attempted to disrupt a speaking event featuring the newly elected president of the American Medical Association.[14] In the other, students successfully disrupted an organized protest of the Hamas attack that was supposed to feature multiple speakers.[15]
To UChicago’s credit, on both of these occasions students, not the administration, suppressed speech. The attempted disruption failed because university security escorted the protesters out of the event so that the speaker could complete his remarks successfully. And, in the aftermath of the disrupted event, the university president reiterated the school’s famous Chicago principles — a positive action that mitigated the penalty applied because of the disruption and which is reflected in the school’s rankings score. He stated:
[N]o member of our community may shout down or seek to prevent the protected expression of those with whom they disagree. You may not tear down a poster. You may not seek to intimidate or threaten another person, or prevent them from hearing an invited speaker. These are egregious offenses against our community.[16]
University of South Carolina and Virginia Commonwealth University: Both of these schools ranked poorly last year. The University of South Carolina was third from the bottom at 246. Virginia Commonwealth University did better, but still not very well, with a ranking of 184. This year both schools made the top 50: VCU ranks 32, and the University of South Carolina ranks 34.
One reason for their overall improvement is that both schools improved their score on “Comfort Expressing Ideas.” VCU moved from a ranking of 150 to a ranking of 108, and it ranks 18 on “Self-Censorship,” suggesting an improved campus speech climate. The University of South Carolina improved its “Comfort Expressing Ideas” ranking from 160 last year to 100 this year. It also improved considerably on “Administrative Support,” ranking 142 last year and 72 this year.
Another reason for these schools' improvement: Both schools worked directly with FIRE on revisions to their policies to earn a "green light" rating. The University of South Carolina adopted the “Chicago Statement” in June 2023 and revised four policies. VCU revised six.[17]
Syracuse University: In the first year of the rankings, Syracuse did poorly, ranking 51 of 55 schools. Over the next three years, it did better, ranking 38 of 154, 132 of 203, and 107 of 248.[18] This year however, Syracuse ranks 246, falling squarely in the bottom 10.
Like Harvard University, Georgetown University, and Rensselaer Polytechnic Institute, Syracuse University has received FIRE’s Lifetime Censorship Award.[19] So how did it receive a middling ranking most years?
Last year, we penalized schools for enacting particularly severe sanctions on students for their speech: expulsion, rescinding acceptance, suspension, denying or revoking a student group’s recognition, or censoring a student newspaper. This year, we expanded the list of severe sanctions that could result in a penalty. We now also penalize schools for terminating a student employee, such as a resident assistant, from their campus job, censoring a student or student group, placing a student or student group under investigation for their expression, and mandating that a student undergo cultural competency or sensitivity training. We also penalize schools at which the student government sanctions a student or a student group for their expression.
We recorded seven student sanctions at Syracuse that impacted the school’s overall score: It suspended a student, censored multiple student groups, initiated four investigations of students, and required a student to participate in “Decision-Making” and “Conflict Coaching” workshops. Each of these incidents occurred in either 2022 or 2023. The suspension is the only incident that would have impacted Syracuse’s overall score last year.[20]
Syracuse University’s decline in the College Free Speech Rankings is not solely due to an expanded universe of student sanctions. We also recorded three deplatformings, all of which occurred in 2023. All these recent incidents — the student sanctions and the 2022 and 2023 deplatformings — may have influenced student survey responses. Last year, Syracuse ranked 15 on “Openness,” 17 on “Comfort Expressing Ideas,” and 123 on “Administrative Support.” This year, it ranks 138, 109, and 157, respectively, on these components.
Barnard College: Barnard’s speech climate was radically altered after Hamas’ October 7 attack on Israel. A month after the attack, the college suspended student groups Students for Justice in Palestine and Jewish Voice for Peace and canceled an event the groups were co-sponsoring featuring Palestinian writer and poet Mohammed el-Kurd.[21]
Earlier this year, protesters attempted to disrupt the incoming president’s inaugural speech and shouted over her as she began her remarks. On another occasion, administrators rejected a panel discussion, forcing student organizers at the last minute to move it off of Barnard’s campus to a location at Columbia University and livestream the event over Zoom.[22]
The school also placed students under investigation for participating in an “unauthorized” protest and called students into an "administrative conduct meeting" for hanging a pro-Palestinian banner outside their dormitory windows during a campus protest, violating a policy prohibiting placing items outside windows.[23]
All of these incidents occurred after October 7.
Barnard also performed poorly on many of the survey-based components of the rankings, finishing in the bottom 15 on “Self-Censorship” (240), second-to-last on “Comfort Expressing Ideas,” and dead last on “Administrative Support.” As already mentioned, Barnard’s “Administrative Support” score is more than two standard deviations below the next-worst school, Harvard University. This suggests that students have noticed how their administration has responded to expression it dislikes.
Warning Colleges
Hillsdale College, with an overall score of 46.73 of 100, outperformed all of the other “Warning” schools in the rankings by at least 10 points. The overall scores of the other five Warning schools range from 17.49 (Saint Louis University) to 34.91 (Liberty University). The table below presents their overall scores.
Table 2: Warning Colleges
| School | Overall Score | Speech Climate |
|---|---|---|
| Baylor University | 24.96 | Warning |
| Brigham Young University | 26.27 | Warning |
| Hillsdale College | 46.73 | Warning |
| Liberty University | 34.91 | Warning |
| Pepperdine University | 29.64 | Warning |
| Saint Louis University | 17.49 | Warning |
Campus Free Expression Since October 7, 2023
The expression climate on American college and university campuses radically changed in fall 2023 with the flaring military hostilities between Hamas and Israel. For instance, in 2023 we recorded 156 deplatforming attempts on American college and university campuses: a record number. Of these attempts, 54 involve a controversy over expression regarding the Israeli-Palestinian conflict. This year, as of this writing, we’ve recorded 110 deplatforming attempts, and 75 of them involve a controversy over expression regarding the Israeli-Palestinian conflict.[24]
In April, campus tensions escalated once again when students protesting Israel’s military actions in Gaza set up encampments on campuses across the country.

2024 Student Encampment Protests
Reports
How did the student encampment protests impact the state of free expression on America’s college campuses?
This section will briefly dive deeper into how student survey responses changed during the encampment protests at Columbia University — and at its affiliated undergraduate women’s college, Barnard College — the epicenter of this protest movement. It will also explore the impact of the encampments on student responses at the University of Southern California, a university in a different region of the country where post-October 7 campus encampment protests also took place.[25]
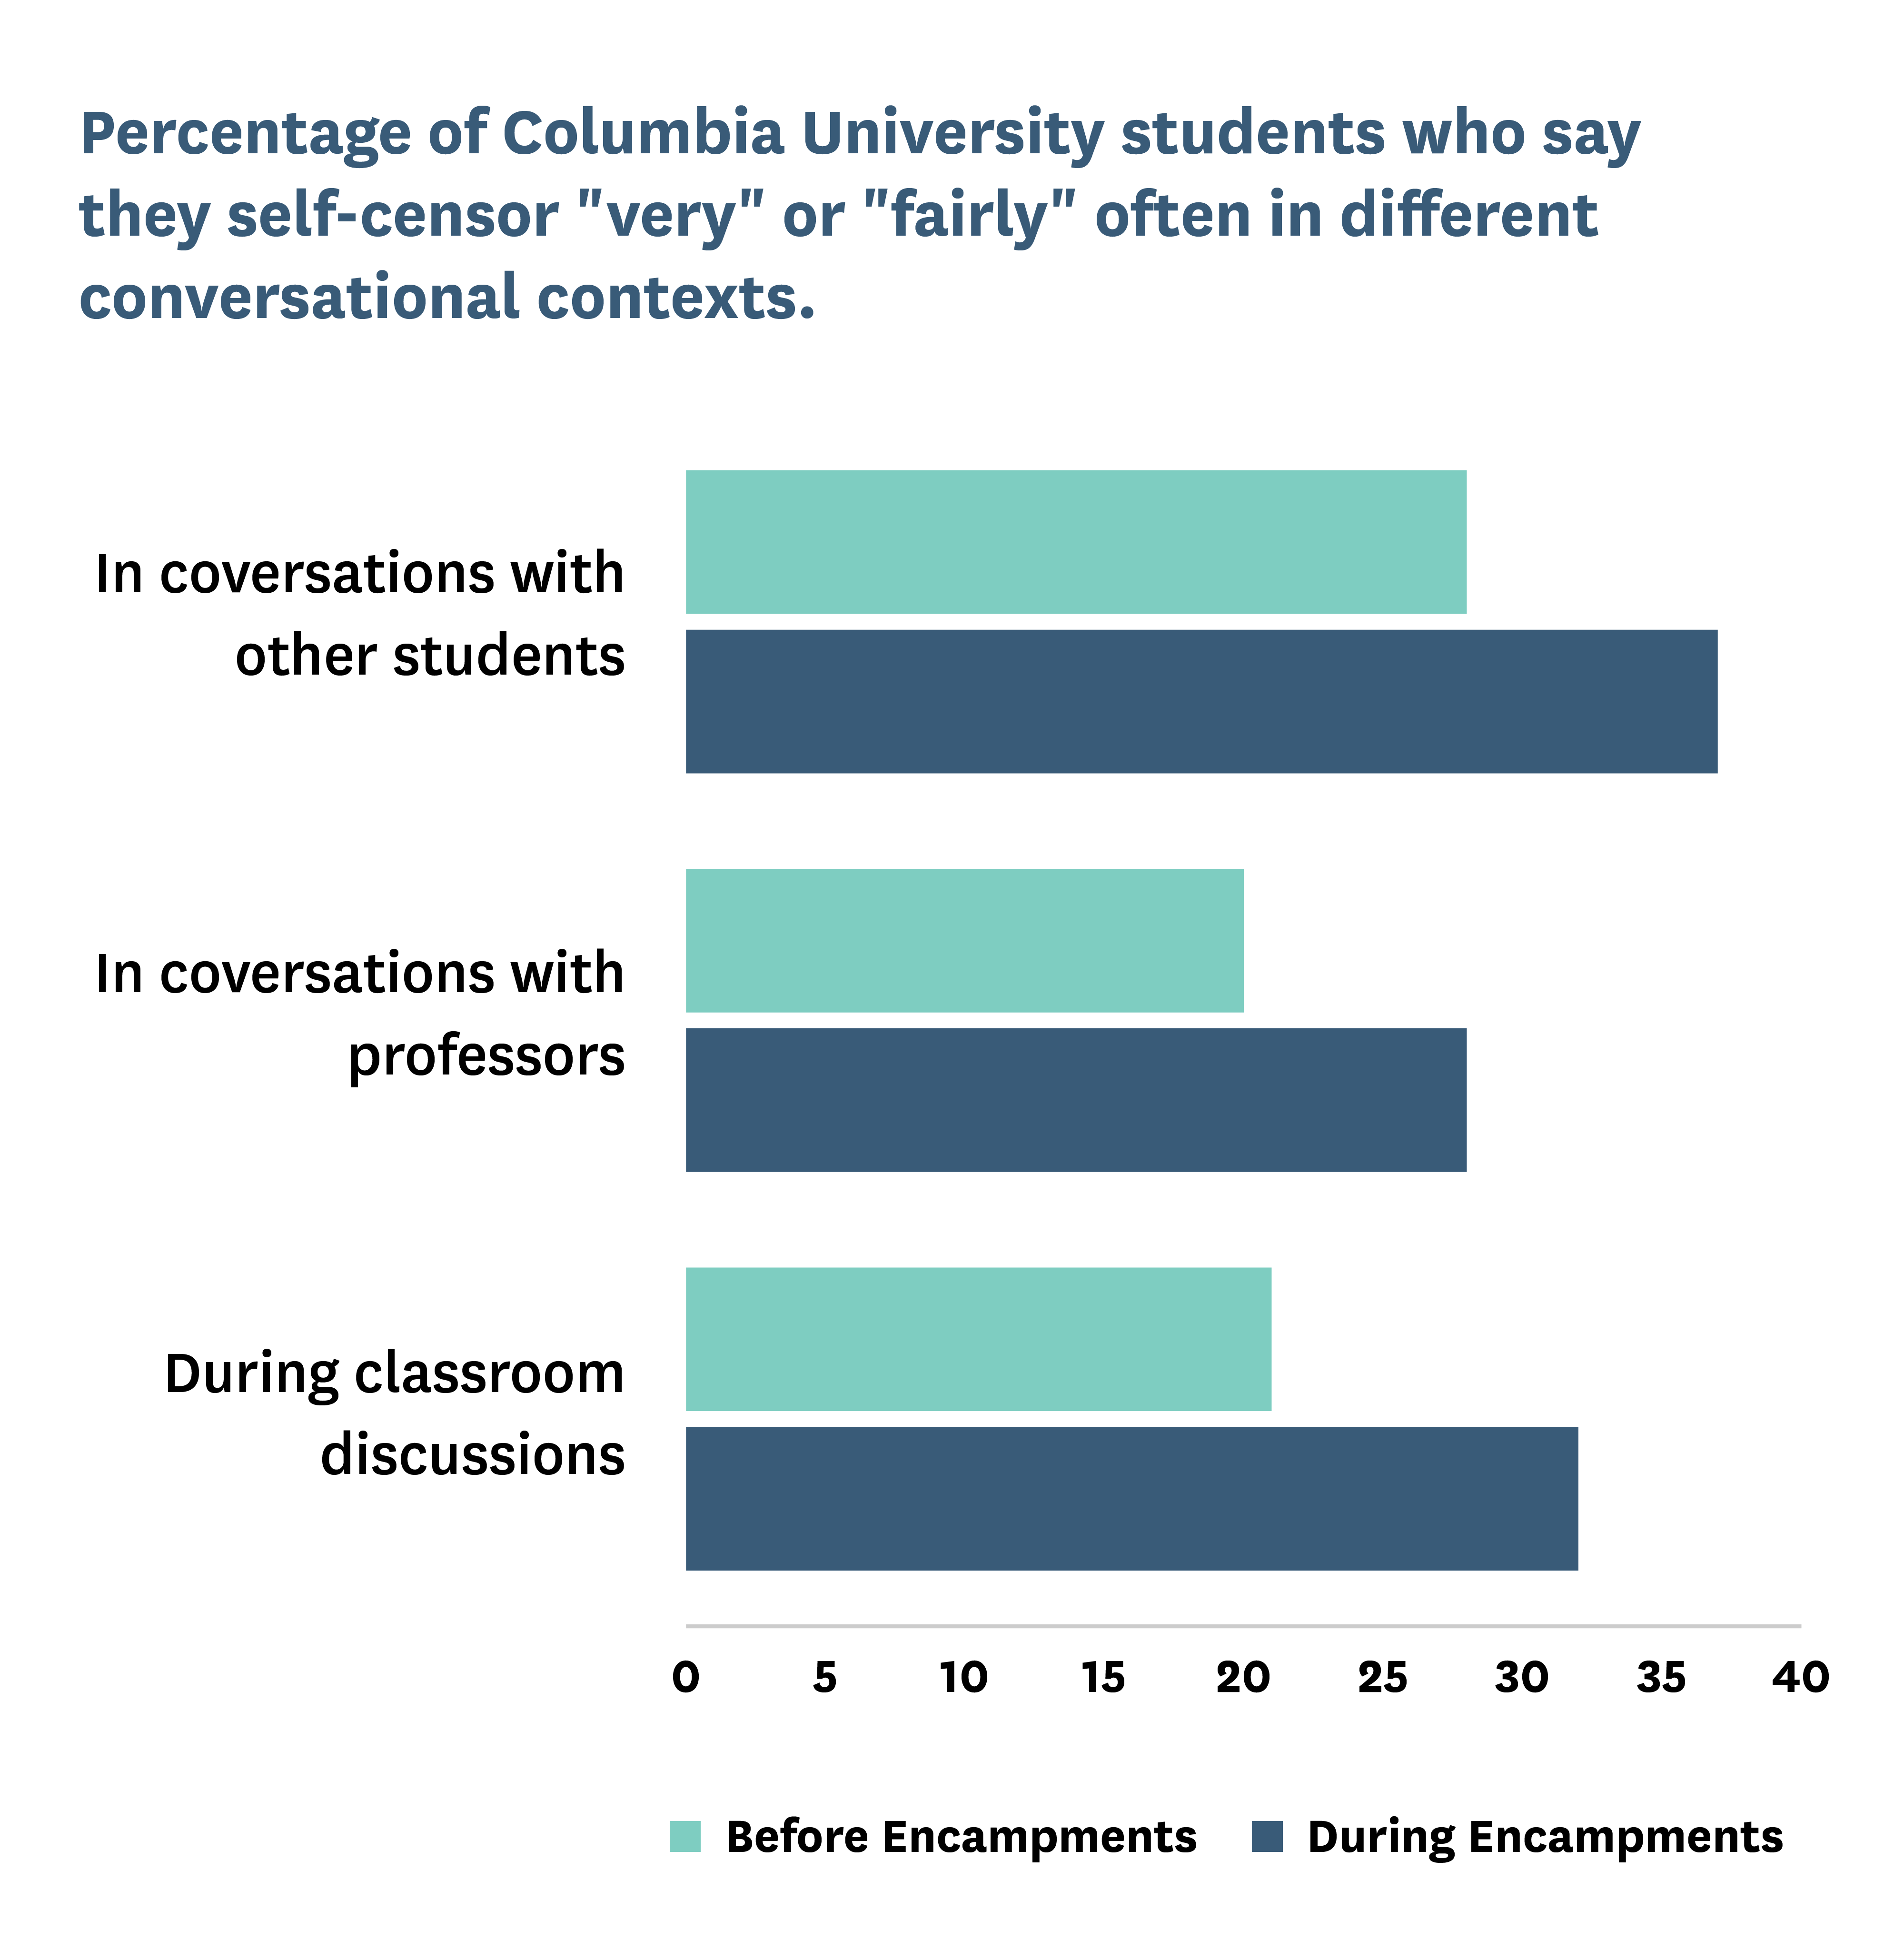
Columbia University: In addition to setting up encampments at Columbia, student protesters occupied Hamilton Hall, a campus academic building. University administrators called the police to campus multiple times. After being called to campus by the administration, the New York City police arrested students on more than one occasion. Administrators then modified commencement ceremony plans.[26]
All of this appears to have impacted how students perceive Columbia’s administration.
Prior to the campus encampments which began on April 17, about 5 in 10 Columbia students said that it is “not at all” or “not very” clear that their administration clearly protects speech on campus. During the encampments, 6 in 10 Columbia students said it is “not at all” or “not very” clear. Much of this shift is the result of more Columbia students saying it is “not at all” clear that their administration protects speech on campus — 26% after the start of the encampments compared to 14% before them. Before the encampments, 37% of Columbia students said it is “not at all” or “not very” likely that the administration would defend a speaker’s rights during a controversy. During the encampments, 46% said the same.
The administration’s response to the encampments appears to have also impacted student self-censorship on campus. Prior to the encampments, when asked how often they feel like they cannot express their opinion because of how a student, professor, or the administration would respond, 27% of Columbia students said they feel this way “at least a couple of times a week.” After the start of the encampments, 36% of Columbia students said the same. Much of this increase is the result of a rise in the percentage of students who said they self-censor “very often,” meaning “nearly every day,” from 4% before the encampments to 15% after the start of the encampments.
Whether a school truly holds free expression as a core value is revealed when that school is tested by controversy. If the past year is any indication, a lot of America’s colleges and universities are failing the test.
Students also reported self-censoring more frequently after the start of the encampments than before them in conversations with other students, conversations with professors, and in classroom discussions.
Barnard College: We already noted that Barnard ranks dead last on “Administrative Support” and suggested that this ranking is the result of the administration’s response to campus events in the wake of October 7. An analysis of Barnard student responses from before and after the encampment protests started suggests that this is indeed the case.
Barnard students did not believe it is clear that their administration protects free speech even before the encampment protests started: 36% said it is “not at all” clear that the administration protects free speech on campus and 32% said it is “not very” clear. During the encampments, these percentages only rose. Forty-seven percent of Barnard students said it is “not at all” clear and 33% said it is “not very” clear that the administration protects free speech on campus. Prior to the encampments, 14% of Barnard students said it is “very” or “extremely” clear that the administration does protect speech on campus. After the encampment protests started only 3% of Barnard students said the same.
When we asked Barnard students how likely their administration would be to defend a speaker’s rights during a controversy, a similar pattern emerged. Before the encampments, 13% said the administration is “not at all” likely to defend a speaker’s rights, and 41% said it is “not very” likely to do so. During the encampments, these percentages increased to 26% and 47%, respectively.
Just like at Columbia, self-censorship among Barnard students noticeably increased after the start of the encampment protests. Prior to the encampments, when asked how often they feel like they cannot express their opinion because of how a student, professor, or the administration would respond, 32% of Barnard students said they feel this way “fairly often,” meaning “at least a couple of times a week.” After the encampments began this percentage increased to 59%. After the encampments began, 31% of Barnard students said they self-censor “very often,” meaning “nearly every day.” Only 10% said the same before the encampment protests.
University of Southern California: In fall 2023, just before October 7, an Armenian student group at USC and others protested a campus speech by Hasan Murat Mercan, objecting to Murat Mercan's pro-Turkish stance in the Nagorno-Karabakh region. Had the protesters successfully canceled or disrupted the event, they would also have prevented speeches by the Azerbaijani consul general and American diplomat James F. Jeffrey. However, the university removed the disruptive protesters from the venue. Protesters physically assaulted Murat Mercan after he left the venue.

USC canceling valedictorian’s commencement speech looks like calculated censorship
News
The university’s move, citing vague ‘safety concerns’ appears designed to placate critics of the student’s Israel criticism.
Then, in the spring, USC canceled valedictorian Asna Tabassum’s commencement speech, claiming allowing the address to proceed would pose “substantial risks relating to security and disruption at commencement.” Yet, there is no evidence that the university received any threats or took any steps to secure the event before it canceled the speech. In fact, the university appears to have been motivated by Tabassum's social media posts which criticized Israel.[27] Making matters worse, after students and faculty objected to the cancellation, the university canceled all of its commencement speakers. These speakers included Jon Chu, Billie Jean King, Maria Rosario Jackson, and Marcia McNutt.[28]
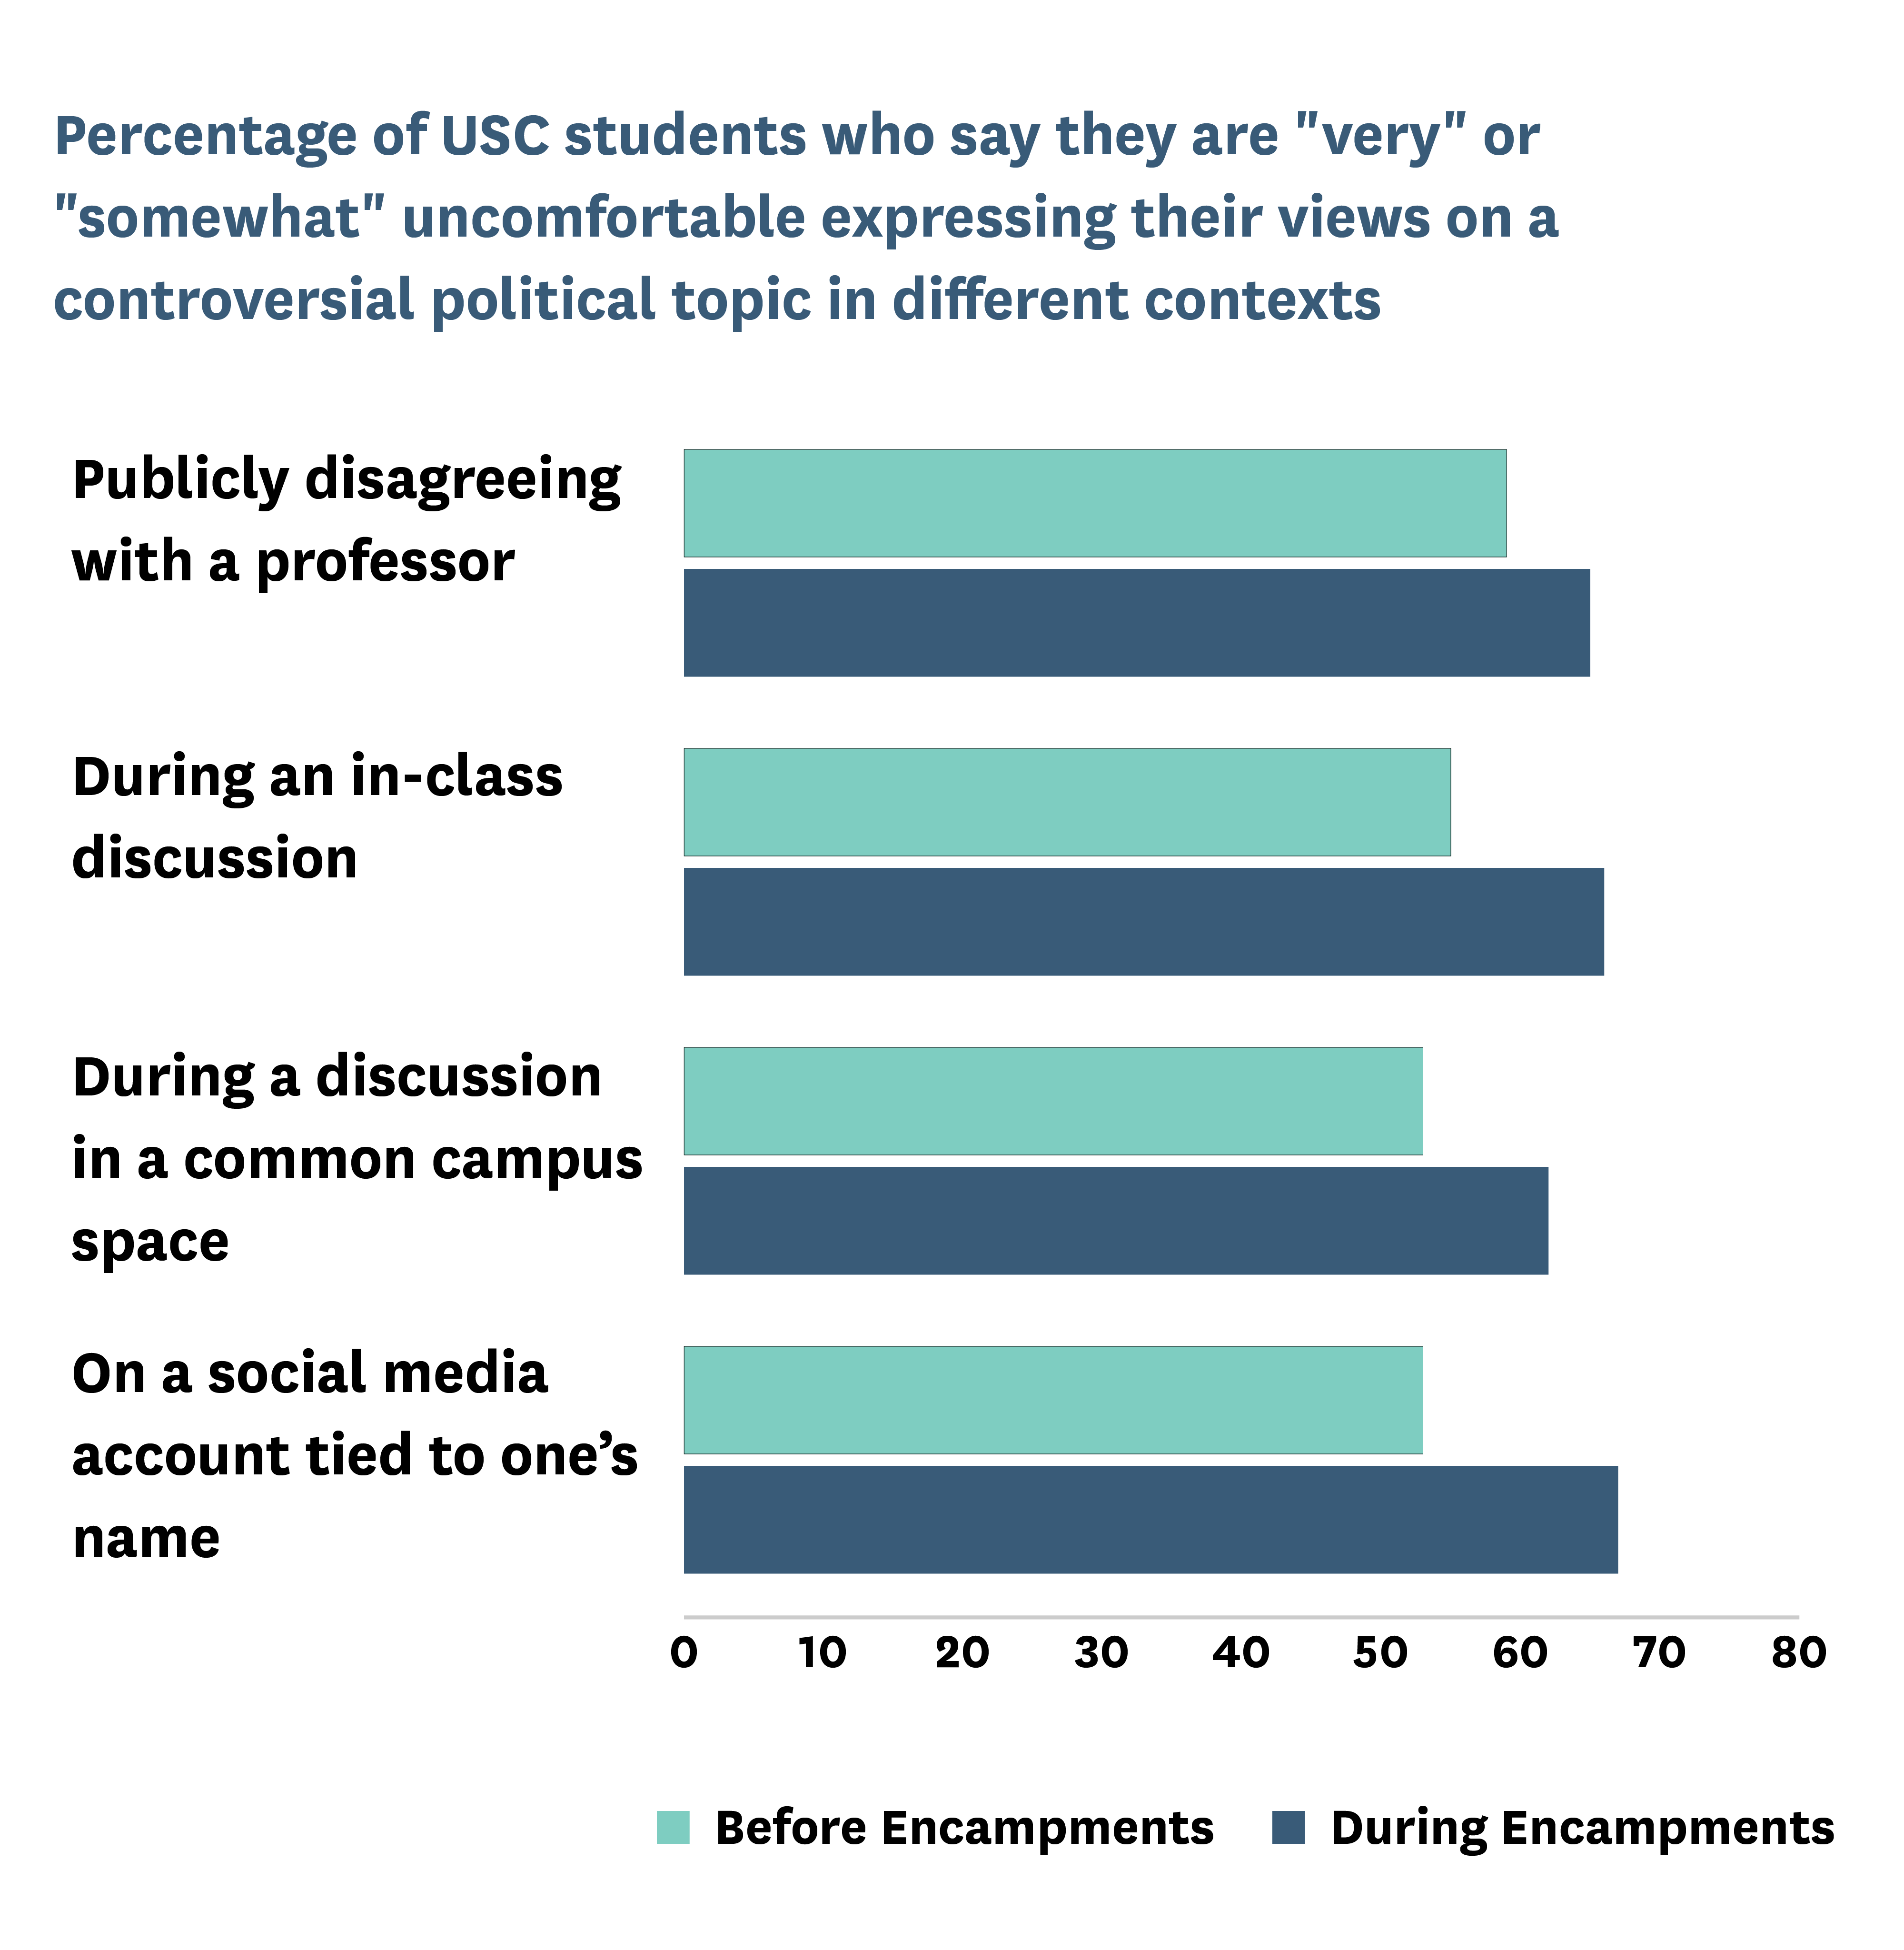
Prior to the start of nationwide campus encampment protests, 88% of USC students said it is at “somewhat,” “very,” or “extremely” clear that their administration protects free speech on campus. Just 12% said that it is “not very” or “not at all” clear that it does so. After the start of the encampments, however, student perceptions changed. Only roughly half of students said it is at least “somewhat” clear that their administration protects free speech. The other half said it is “not at all” or “not very” clear. As with Columbia and Barnard, a similar issue emerged when we asked USC students how likely their administration would be to defend a speaker’s rights during a controversy. Before the encampments, only 3% said the administration is “not at all” likely to defend a speaker’s rights, whereas after the start of the encampments, 23% said the same.
Higher percentages of USC students reported discomfort expressing controversial views publicly on campus during the encampments. Prior to the encampments, 53% said they feel “very” or “somewhat” uncomfortable expressing controversial political views on a social media account tied to their name. After the start of the encampments, 67% said the same. When we asked USC students about their comfort publicly disagreeing with a professor, expressing their views during an in-class discussion, and expressing their views in a common campus space both before and after the start of the encampments, we found similar, though smaller, increases in discomfort after the start of the encampments. However, we found no discernible difference in student comfort disagreeing with a professor in a written assignment, a more private action, before versus after the start of the encampments.
National Data
Since 2020, we have surveyed more than 200,000 undergraduates for the College Free Speech Rankings. This year’s survey is the largest ever conducted on undergraduate attitudes about and experience with free expression on college campuses, with a sample size of 58,807. The remainder of this report summarizes the survey’s findings at the national level. All data presented in this section are weighted to provide a nationally representative sample of four-year college undergraduate students.
Student Political Views
Of the students surveyed, 47% identified as politically liberal, 21% identified as conservative, and 16% identified as moderate. The remaining students identified as Democratic Socialists (3%), Libertarians (2%), something else (4%), or said they “haven’t thought much about this” (8%). Seven students (0.01%) did not provide an answer.
Unsurprisingly, 228 of the 257 schools surveyed had a predominantly liberal student body, while only 29 schools had a predominantly conservative one. This latter group includes four of the six “Warning” schools: Baylor University, Brigham Young University, Hillsdale College, and Liberty University.
At two schools — Kenyon College and Pitzer College — only one student identified as conservative. At Macalester College, not a single student identified as conservative. The average liberal-to-conservative student ratio on the 228 predominantly liberal campuses is 7:1, with an extremely unbalanced maximum of 85:1 at Kenyon. In contrast, the average conservative-to-liberal student ratio on the 29 predominantly conservative campuses is 2:1, with a maximum of 5:1 at Hillsdale. With the exception of the University of Mississippi, which has a conservative-to-liberal student ratio of 4:1, the predominantly conservative campuses have conservative-to-liberal student ratios of 2:1 or less.
How Do Students Perceive the Administration’s Support for Free Speech?
More than 2 in 5 students (42%) reported that it is only “somewhat” clear that their administration protects free speech on campus, while roughly a quarter (24%) reported that it is “not at all” or “not very” clear that it does so.
Additionally, 47% reported that their administration would only be “somewhat” likely to defend a speaker’s right to express their views if a speech controversy occurred on campus. More than a quarter, 28%, reported that their administration would be “not at all” or “not very” likely to do so.
More than half of students identified the Israeli-Palestinian conflict as a topic that is “difficult to have an open and honest conversation about” on campus, up from 26% last year.
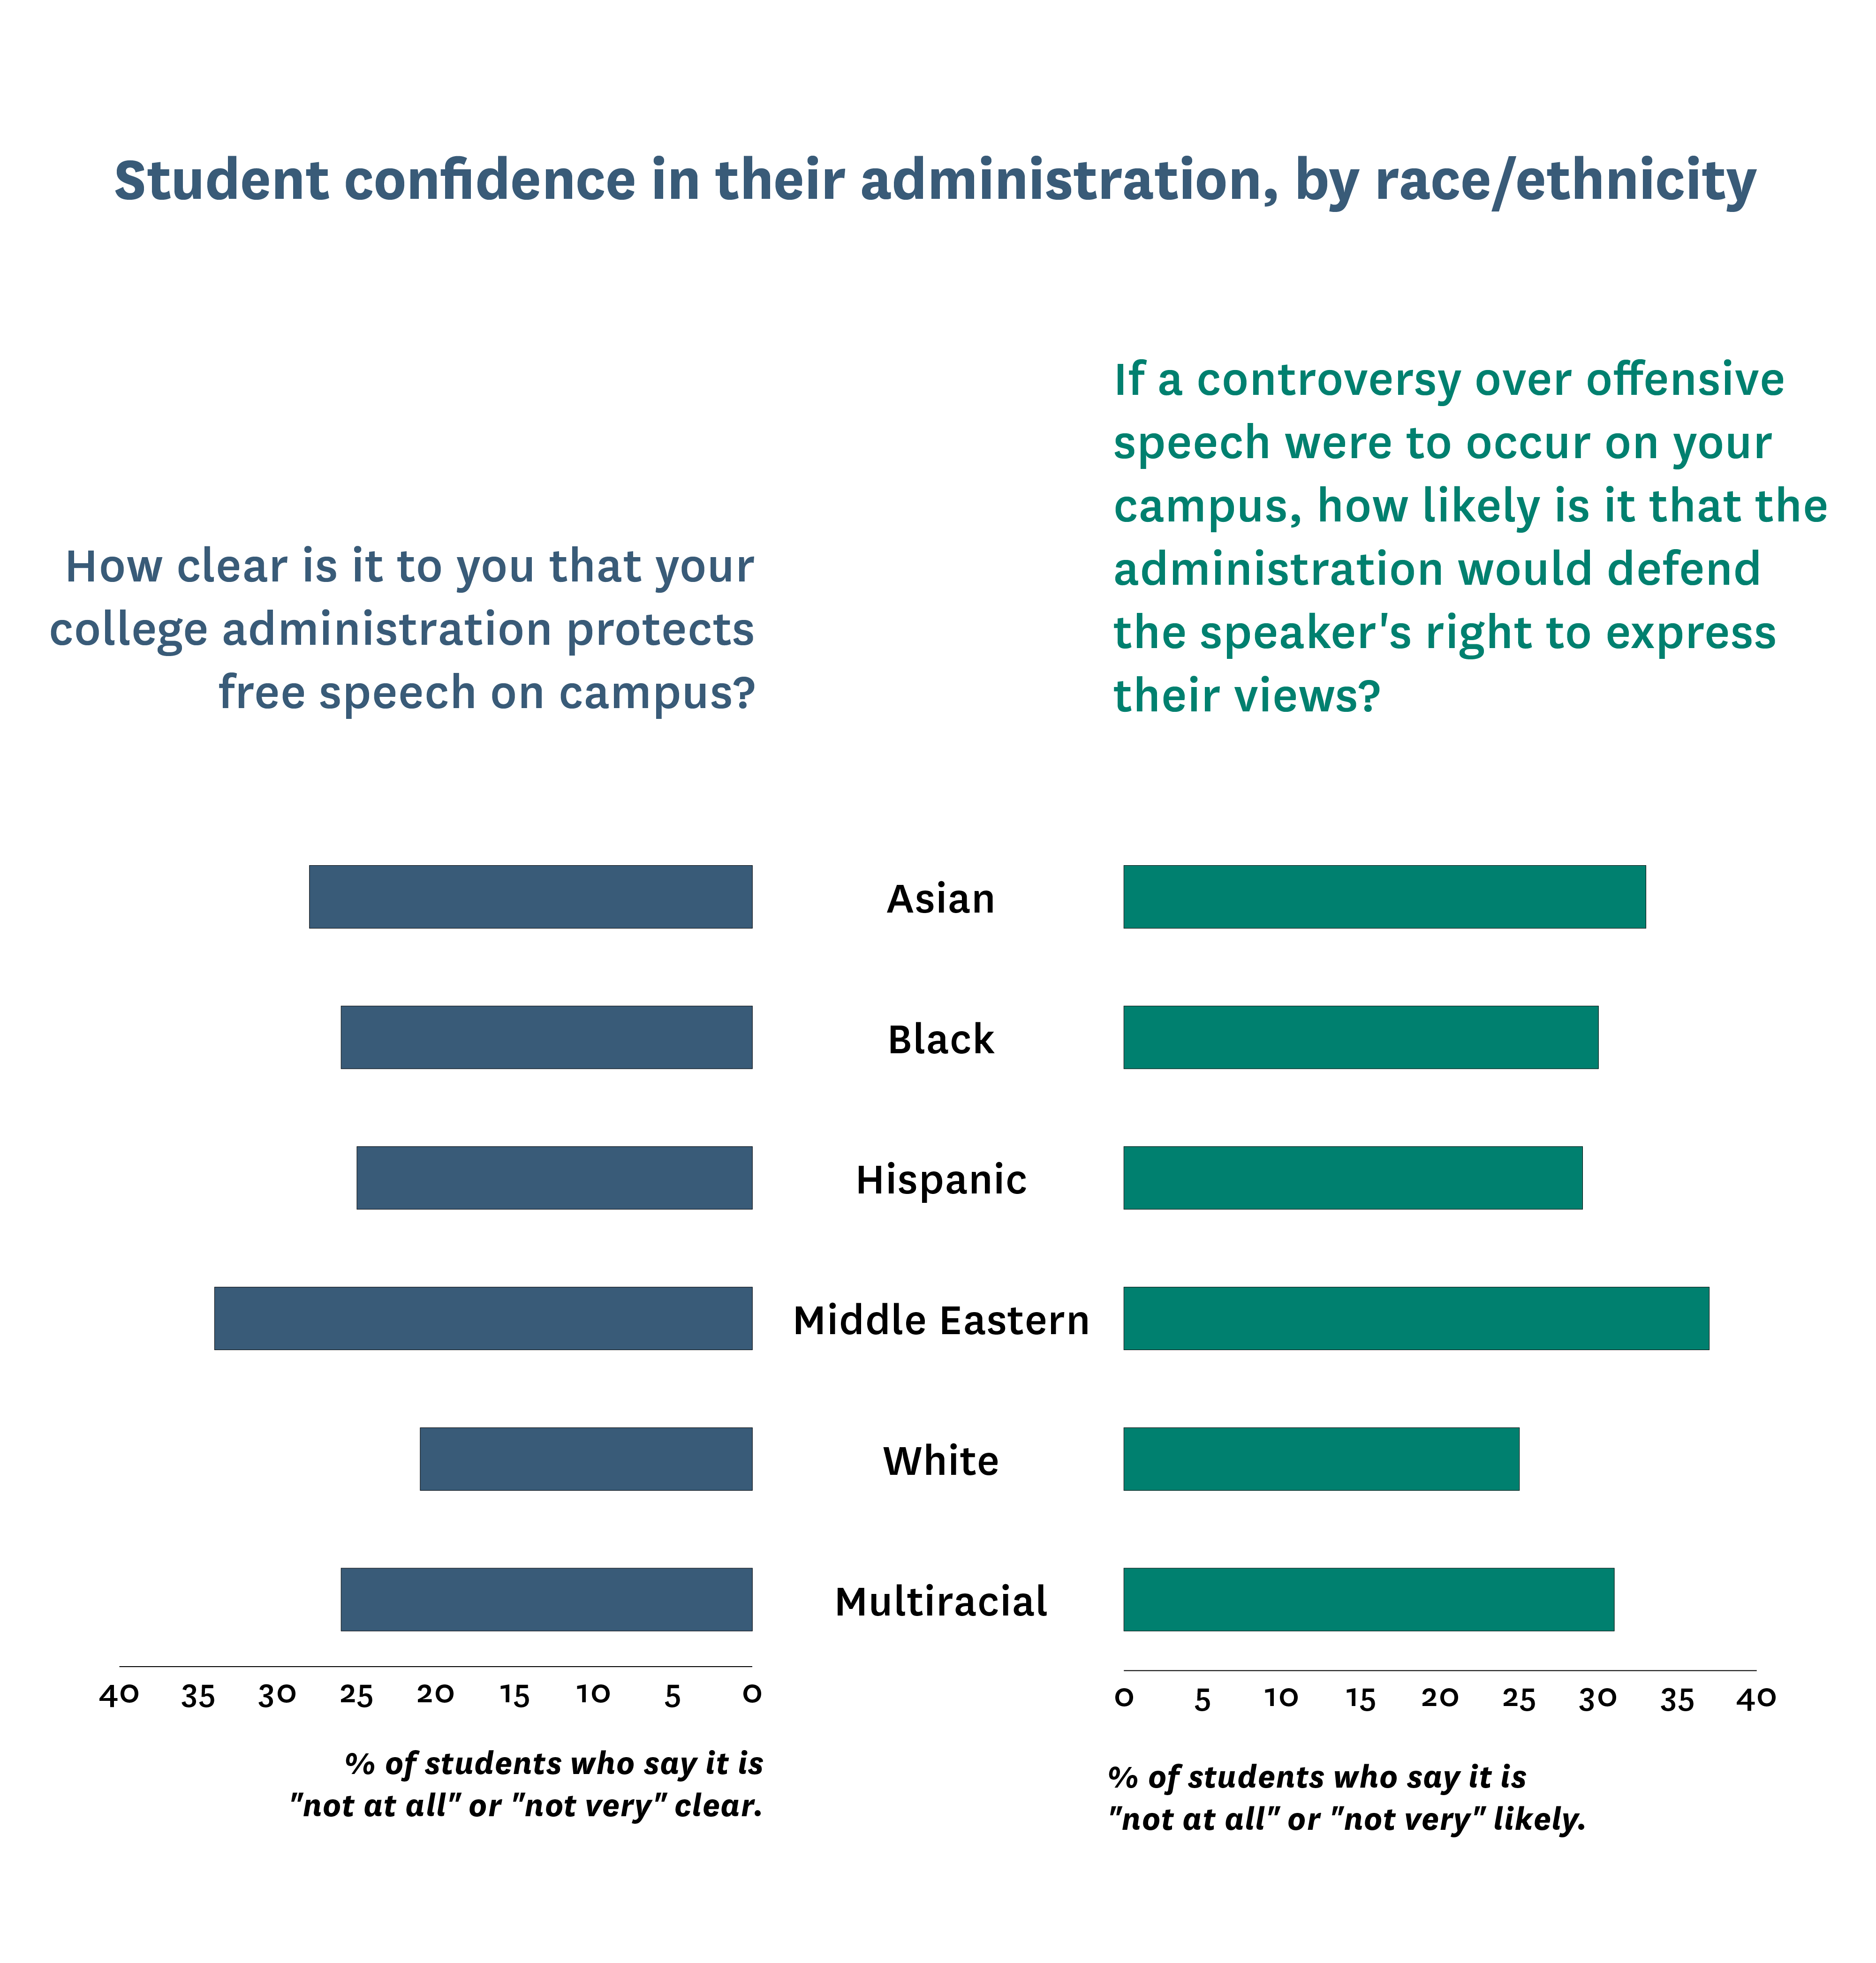
Although Middle Eastern students make up a small portion of the sample (0.5%), their lack of confidence in their administration’s willingness to protect free speech on campus stands out in comparison to the views of other racial and ethnic groups. A third of Middle Eastern students reported that it is “not at all” or “not very” clear that the administration protects free speech on campus, and 37% reported that the administration would be “not at all” or “not very” likely to defend a speaker’s rights during a speech controversy.
How Comfortable Are Students Expressing Political Views on Campus?
Overall, students reported low levels of comfort expressing their views on controversial political topics across five different contexts on campus.
The percentage of students who reported feeling “very” or “somewhat” comfortable ranges from a low of 34%, when expressing an unpopular political opinion to other students on a social media account tied to one’s name, to a high of 50%, when expressing views on a controversial political topic to other students during a discussion in a common campus space or when disagreeing with a professor in a written assignment.
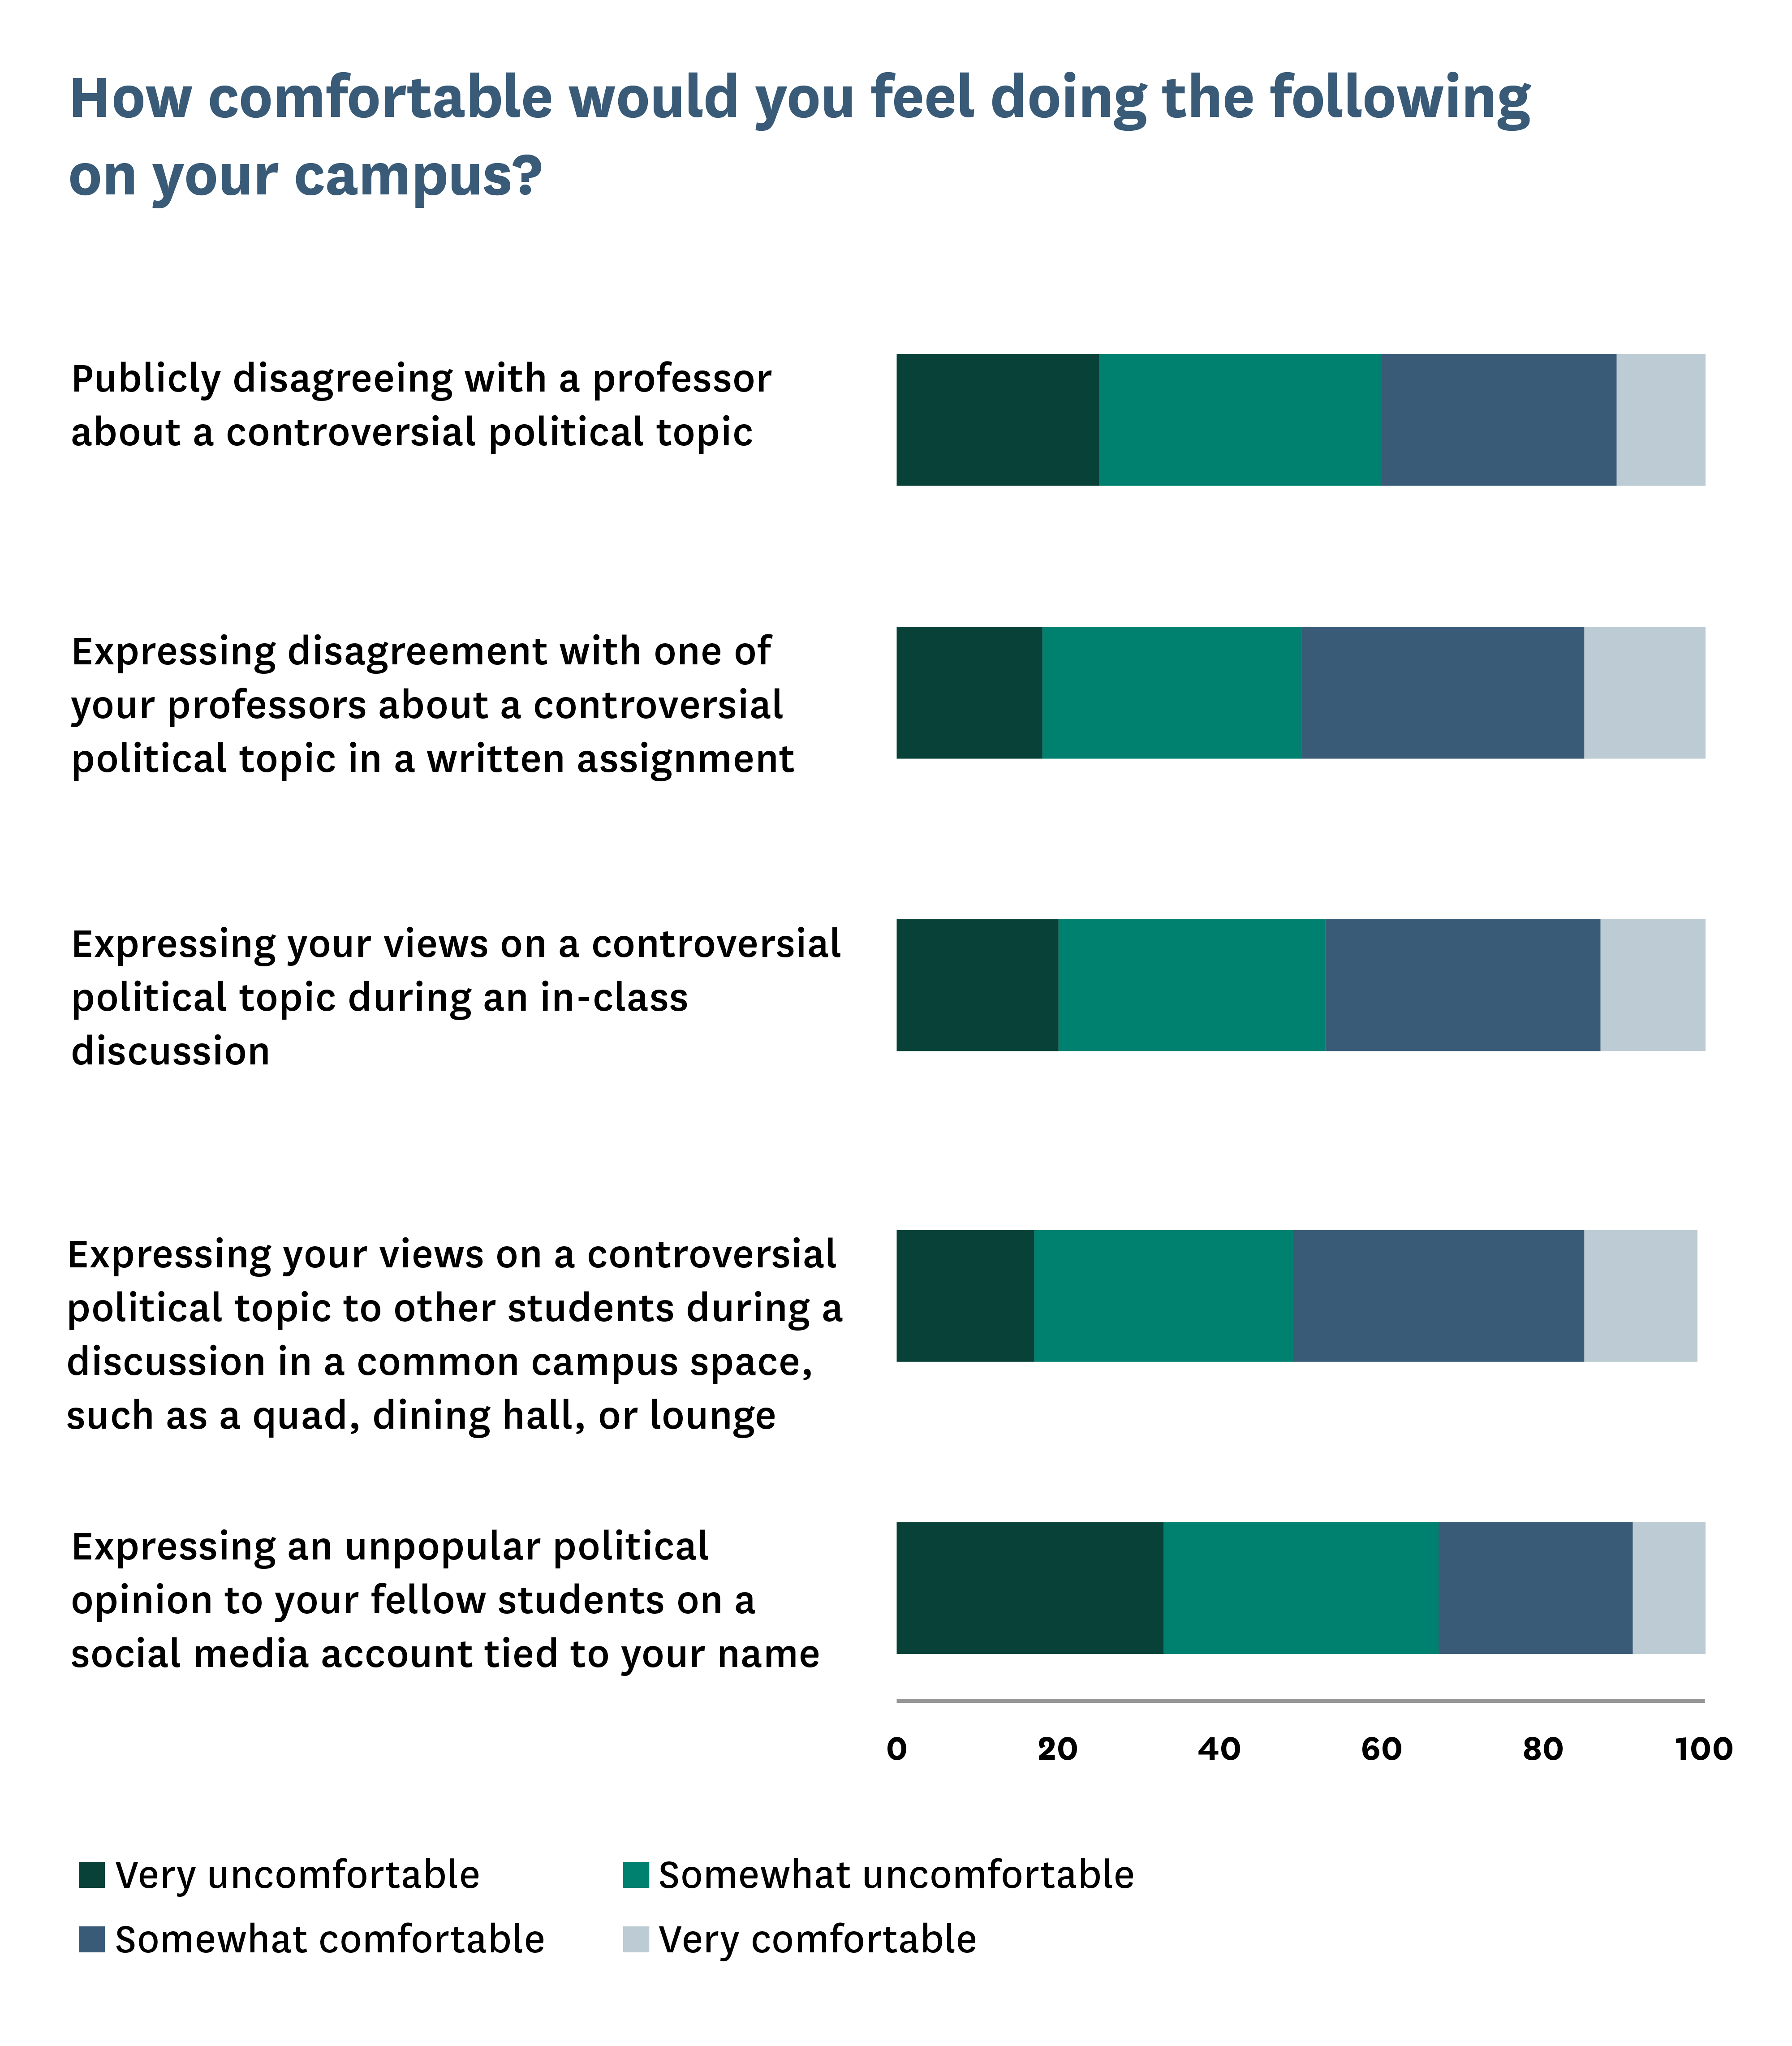
Male students were more likely than female students to say they are “very” or “somewhat” comfortable expressing their views in a number of campus contexts:
- 52% of male students and 48% of female students said they are “very” or “somewhat” comfortable expressing their views on a controversial political topic to other students during a discussion in a common campus space such as a quad, dining hall, or lounge.
- 50% of male students and 44% of female students said they are “very” or “somewhat” comfortable expressing their views on a controversial political topic during an in-class discussion.
- 44% of male students and 34% of female students said they are “very” or “somewhat” comfortable publicly disagreeing with a professor about a controversial political topic.
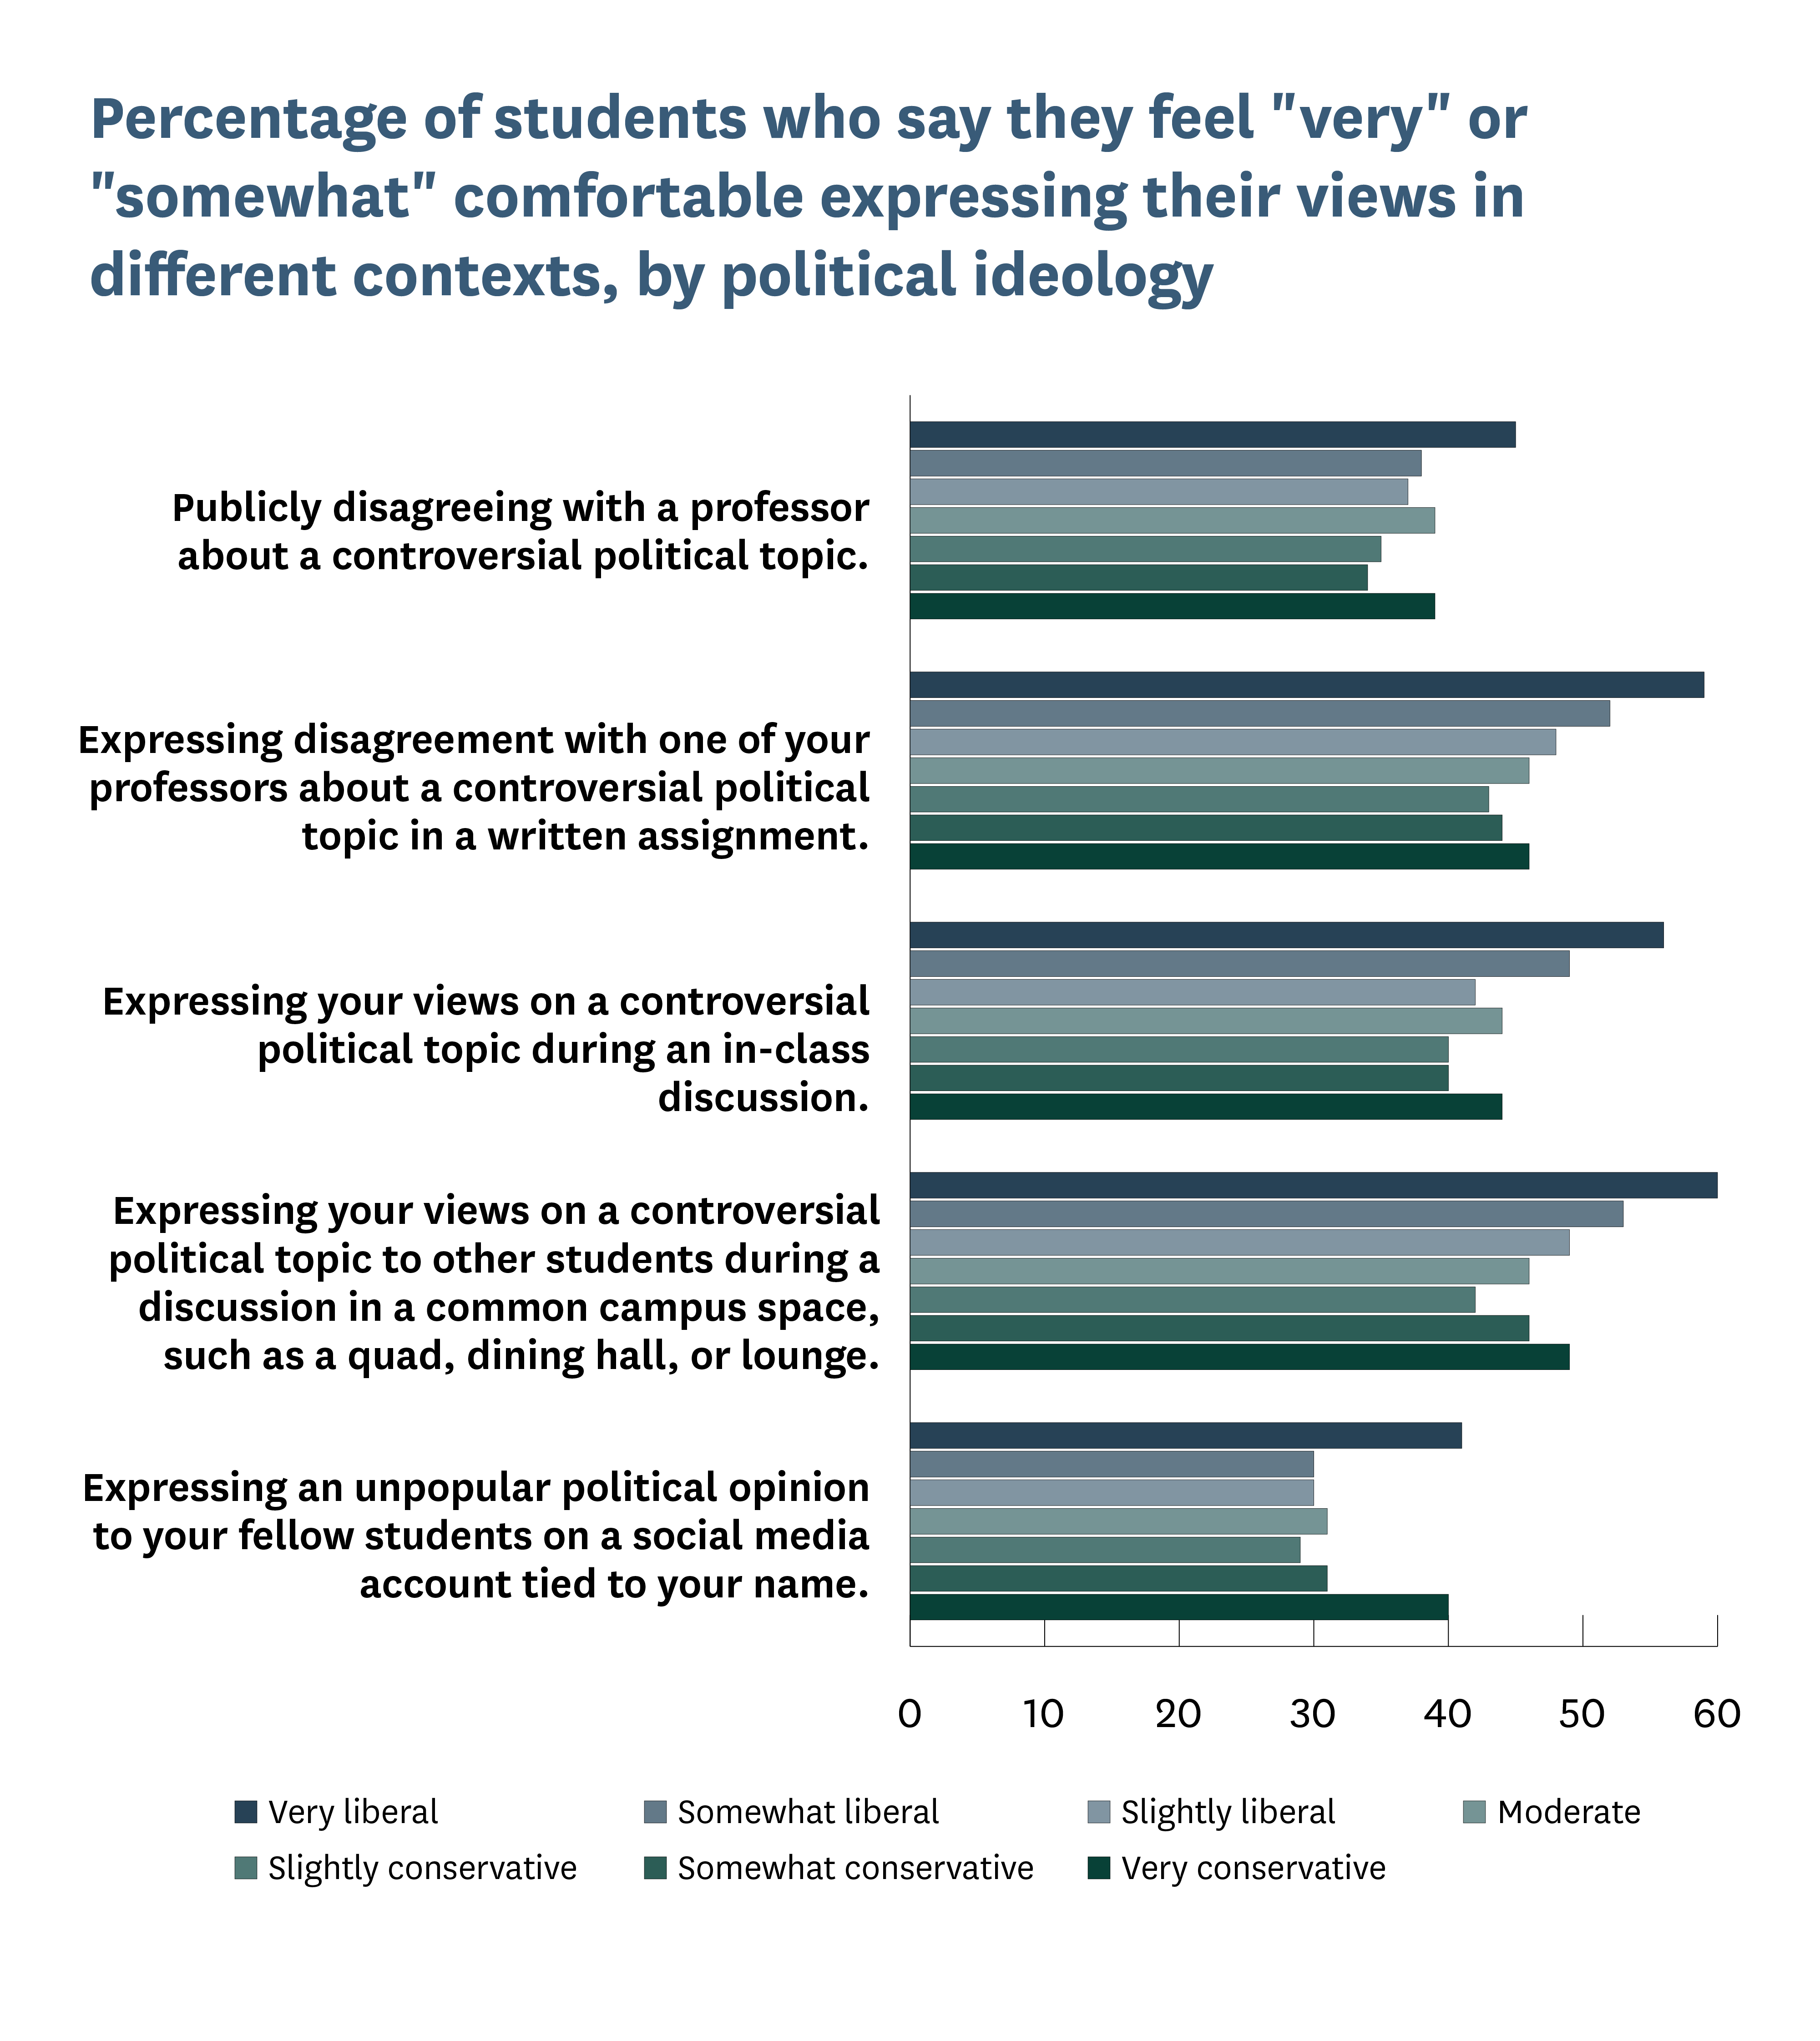
Very liberal students were also more likely than all other students on campus — including somewhat liberal and slightly liberal students — to say they are “very” or “somewhat” comfortable expressing their views.
How Often Do Students Self-Censor on Campus?
On a positive note, college students’ concern about self-censorship has declined. This year, 17% of students said they “very” or “fairly” often feel like they cannot express their opinion on a subject because of how students, a professor, or the administration would respond. Last year, this percentage was 20%, and in 2022 it was 22%[29].
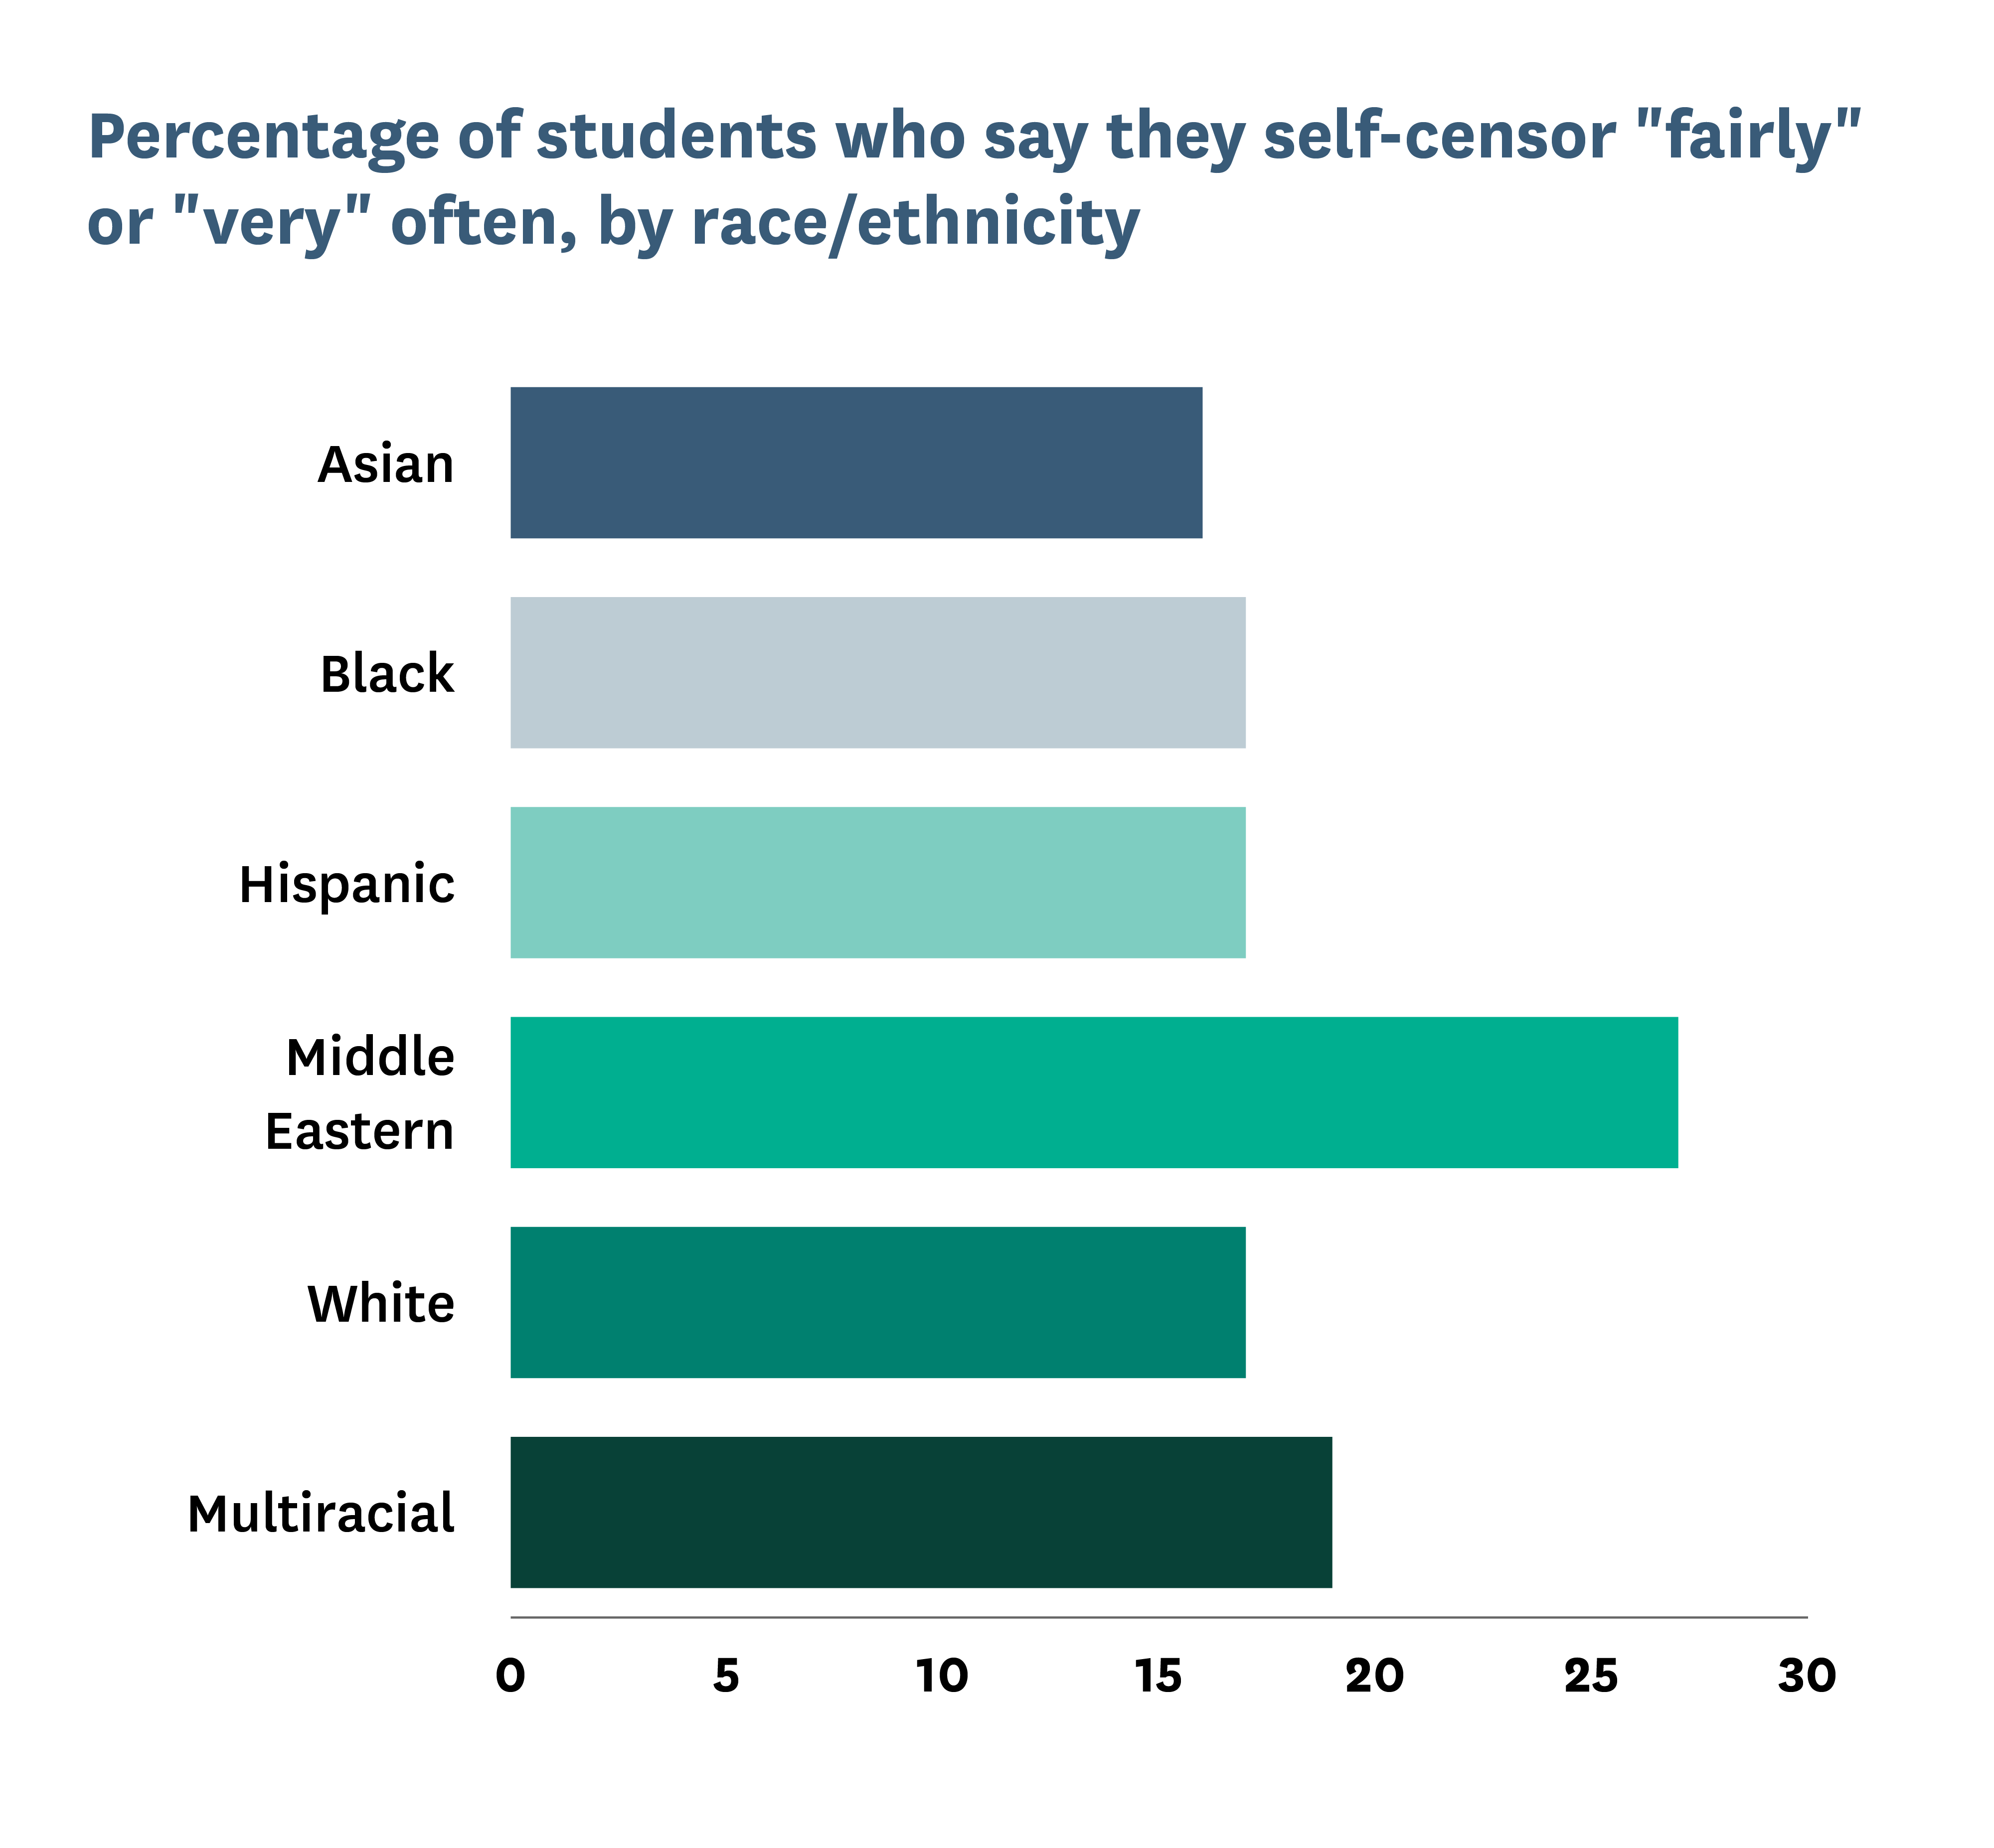
Like last year, we provided students with a definition of self-censorship.[30] We then asked three questions about how often they self-censor on campus.[31] A quarter of students said they self-censor “very” or “fairly” often during conversations with other students. And about a quarter of students said they self-censor “very” or “fairly” often during classroom discussions, in conversations with professors, and in conversations with other students.
Middle Eastern students reported self-censoring more often than Asian, Black, Hispanic, White, and multiracial students.
Very conservative students reported self-censoring most often, with roughly a third (34%) saying they do so “very” or “fairly” often. About a quarter of somewhat conservative students (24%) reported self-censoring “very” or “fairly” often, as did about a fifth of slightly conservative students (22%).
In contrast, only 15% of very liberal students reported self-censoring “very” or “fairly” often. Twelve percent of somewhat liberal students, 13% of slightly liberal students, and 17% of moderate students said the same.
![Bar graph showing percentage of how “often” students self-censor in each setting by political ideology.]](https://www.thefire.org/sites/default/files/2024/08/2025-CFSR_figure%208.png)
Which Topics Do Students Find Difficult to Discuss?
More than half of students (55%) identified the Israeli-Palestinian conflict as a topic that is “difficult to have an open and honest conversation about” on campus, up from 26% last year. This is only the second time in five years that more than half of all students surveyed identified a particular topic as difficult to “have an open and honest conversation about” on campus — in 2021, 51% of students said that racial inequality is difficult to discuss.
Of the 2,069 Jewish students who responded to this survey question, roughly three-quarters (74%) said that the Israeli-Palestinian conflict is a difficult topic to discuss on campus. About three-fifths of agnostic students (63%), Muslim students (59%), and atheist students (58%) said the same. Slightly more than half of Protestant students (54%) and Catholic students (53%) agreed that the Israeli-Palestinian conflict is a difficult topic to discuss on campus, while slightly lower percentages of Buddhist students (49%) and Hindu students (45%) said the same.

College Protests and the First Amendment
Issue Pages
What are your free speech rights when there is a college protest on campus? FIRE explains your civil liberties on campus during times of protest.
At some schools the percentage of students who said that the Israeli-Palestinian conflict is a difficult topic to discuss on campus is considerably higher than 54%.
At the following schools, at least 80% of students said the Israeli-Palestinian conflict is difficult to discuss:
- Barnard College (88%)
- Pomona College (85%)
- Brandeis University (84%)
- American University (84%)
- Vassar College (82%)
At the following schools, at least three-quarters of students said the Israeli-Palestinian conflict is difficult to discuss:
- Mount Holyoke College (79%)
- Skidmore College (79%)
- Tulane University (79%)
- Columbia University (78%)
- Scripps College (78%)
- Massachusetts Institute of Technology (77%)
- Colorado College (76%)
- Washington University in St. Louis (76%)
- Bowdoin College (75%)
- George Washington University (75%)
- Middlebury College (75%)
- University of Denver (75%)
When asked which topics are “difficult to have an open and honest conversation about” on campus, 45% of students identified abortion, 41% identified transgender rights, 36% identified racial inequality, and 36% identified gun control. From last year to this year, the percentage of students who identified each of these topics as difficult to discuss declined.
Table 3. Trends in difficult topics to discuss on campus, 2020-present
| Topic | 2020 | 2021 | 2022 | 2023 | 2024 |
|---|---|---|---|---|---|
| Abortion | 45% | 46% | 49% | 49% | 45% |
| Affirmative action | 30% | 29% | 26% | 23% | 24% |
| China | Not asked | 22% | 20% | 15% | 13% |
| Climate change | Not asked | 19% | 18% | 18% | 14% |
| Economic inequality | Not asked | 33% | 28% | 25% | 22% |
| Freedom of speech | Not asked | Not asked | 27% | 24% | 22% |
| Gender inequality | Not asked | 37% | 35% | 35% | 29% |
| Gun control | 41% | 44% | 43% | 43% | 36% |
| Immigration | 36% | 34% | 33% | 29% | 27% |
| Israeli-Palestinian conflict | 30% | 30% | 31% | 26% | 55% |
| Police misconduct | Not asked | Not asked | 43% | 36% | 31% |
| Race/Racial inequality | 43% | 51% | 48% | 42% | 36% |
| Sexual assault | Not asked | Not asked | 38% | 37% | 29% |
| Transgender issues/ Transgender rights | 40% | 40% | 42% | 44% | 41% |
Conservative students, and particularly very conservative students, were more likely than liberal or moderate students to say that abortion, transgender rights, and racial inequality are difficult topics to discuss on campus. This pattern reverses for the Israeli-Palestinian conflict. Liberal students, particularly very liberal students, were more likely than conservative or moderate students to say that the Israeli-Palestinian conflict is difficult to discuss.

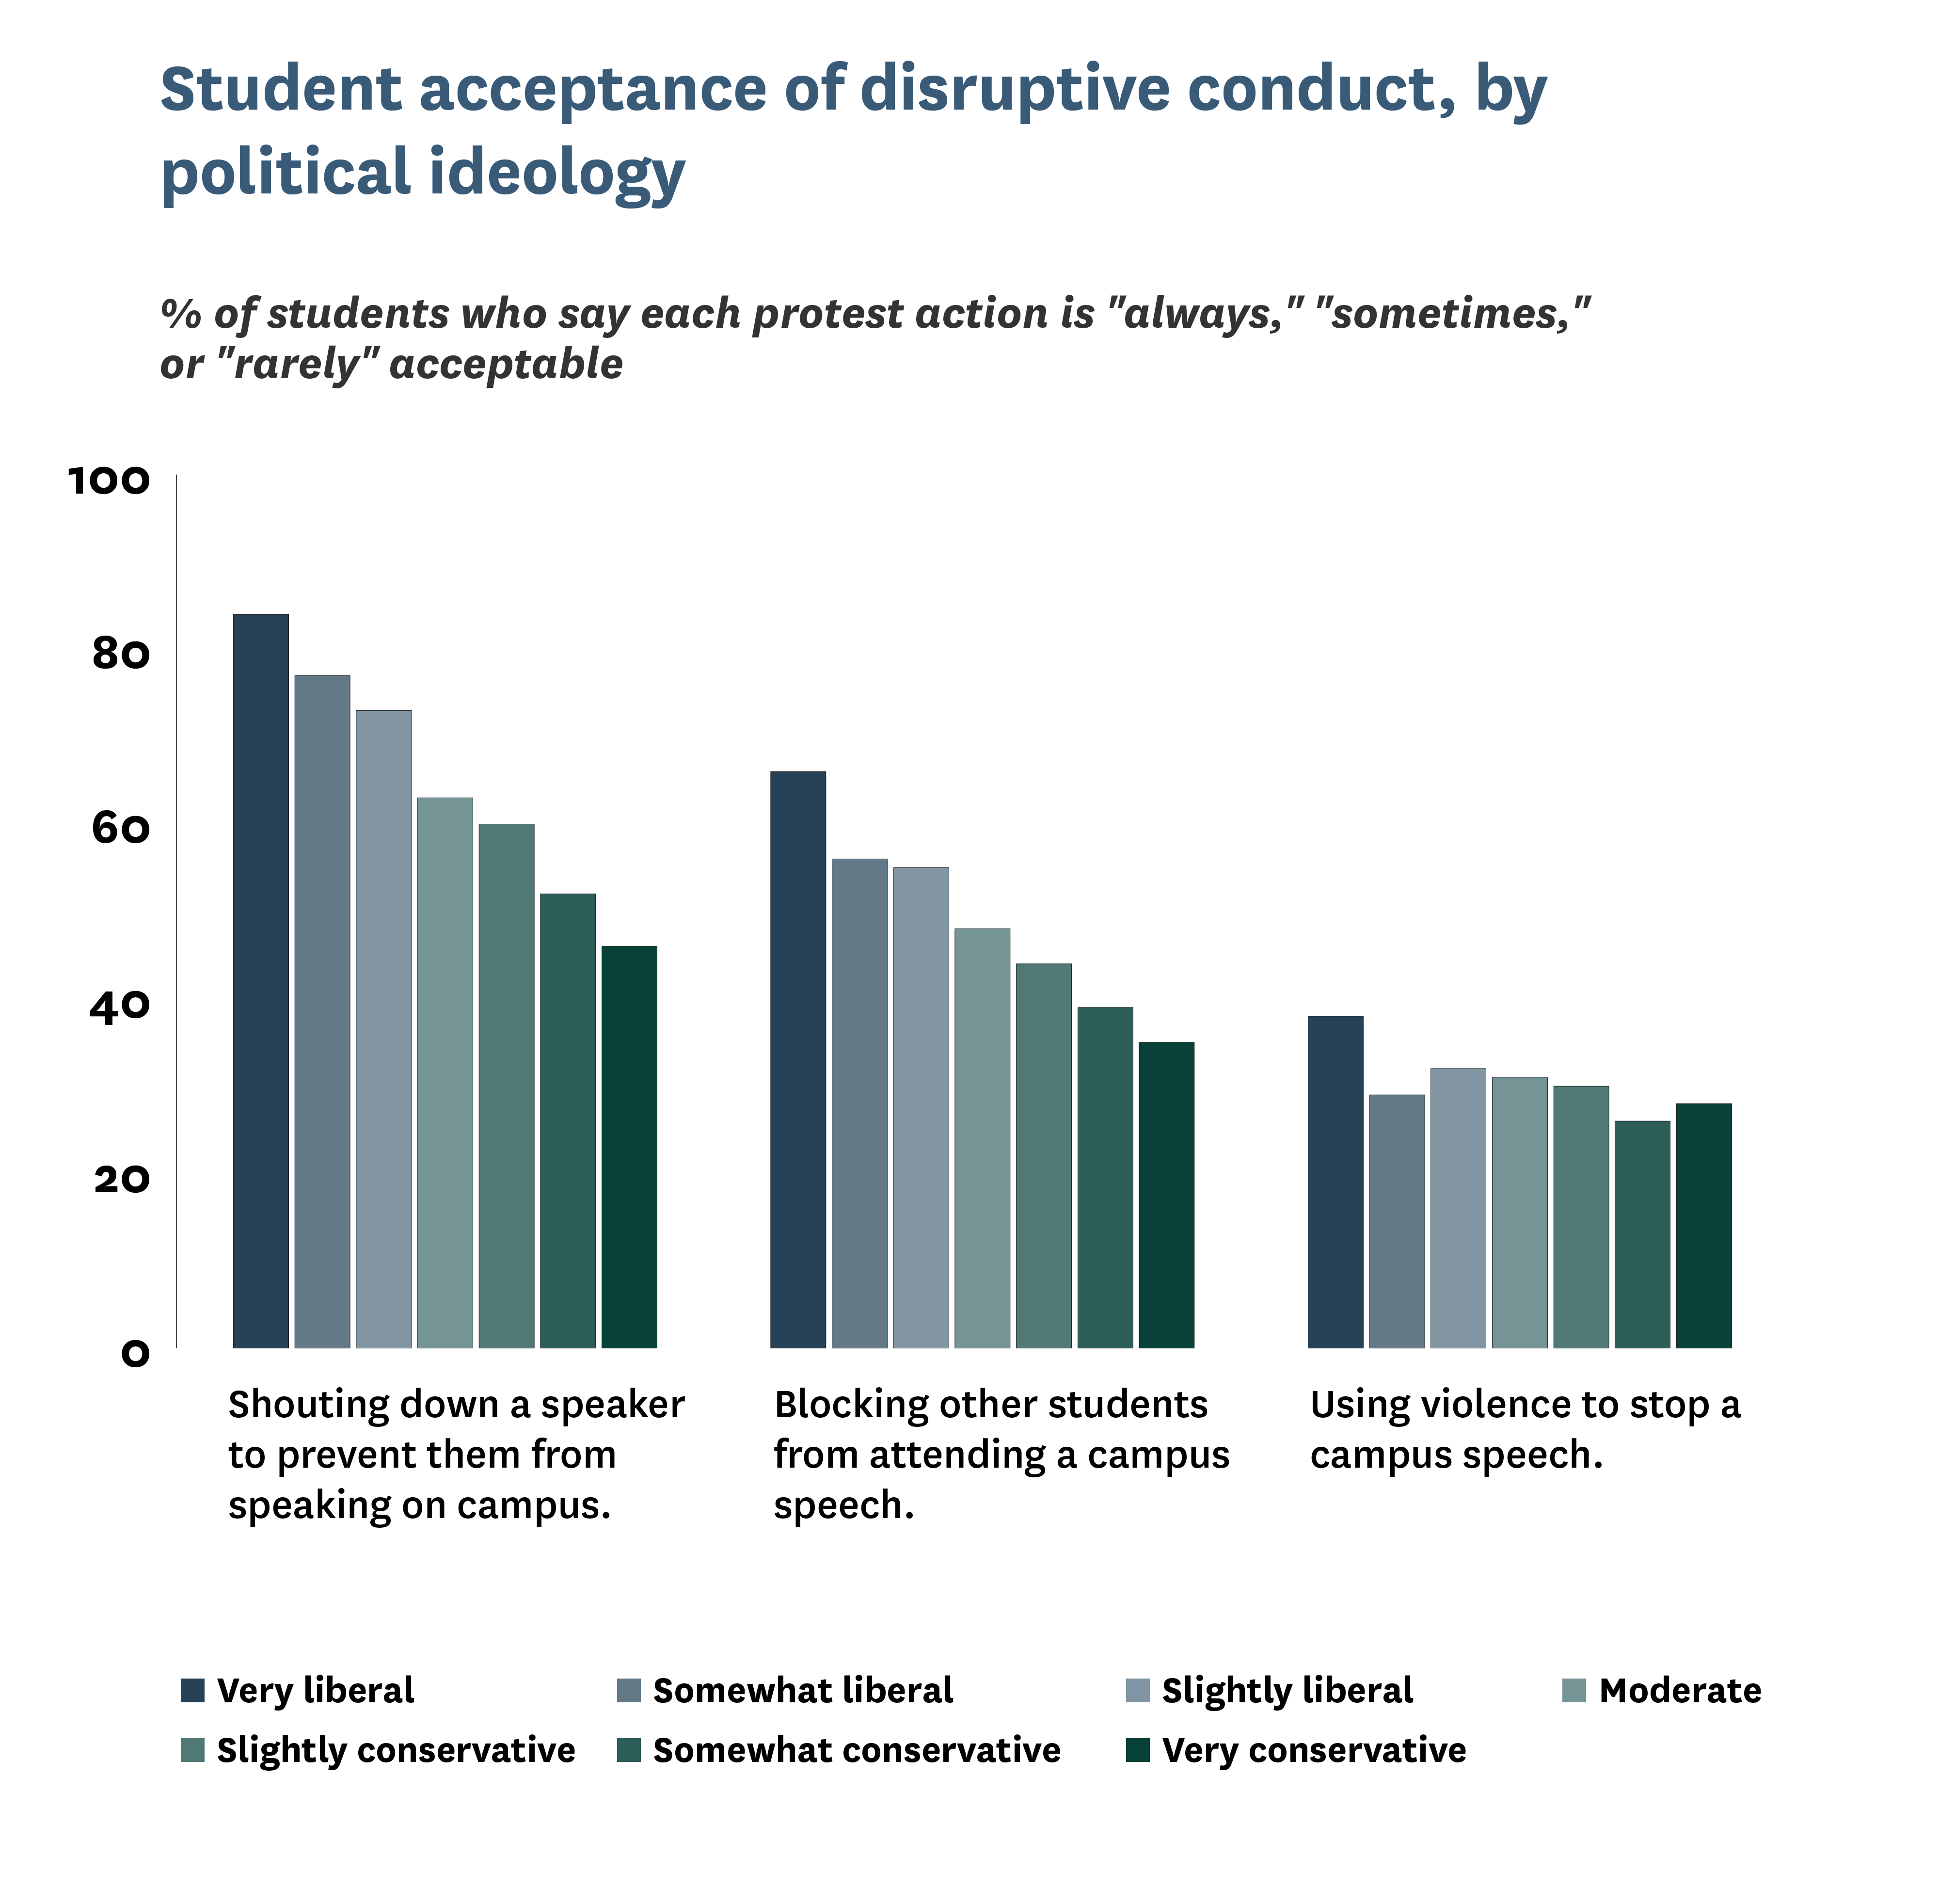
How Acceptable Do Students Consider Different Forms of Disruptive Conduct?
Although most students oppose the use of disruptive tactics to stop a campus speech, disappointing proportions find such tactics acceptable to some degree (answering “always,” “sometimes,” or “rarely”).
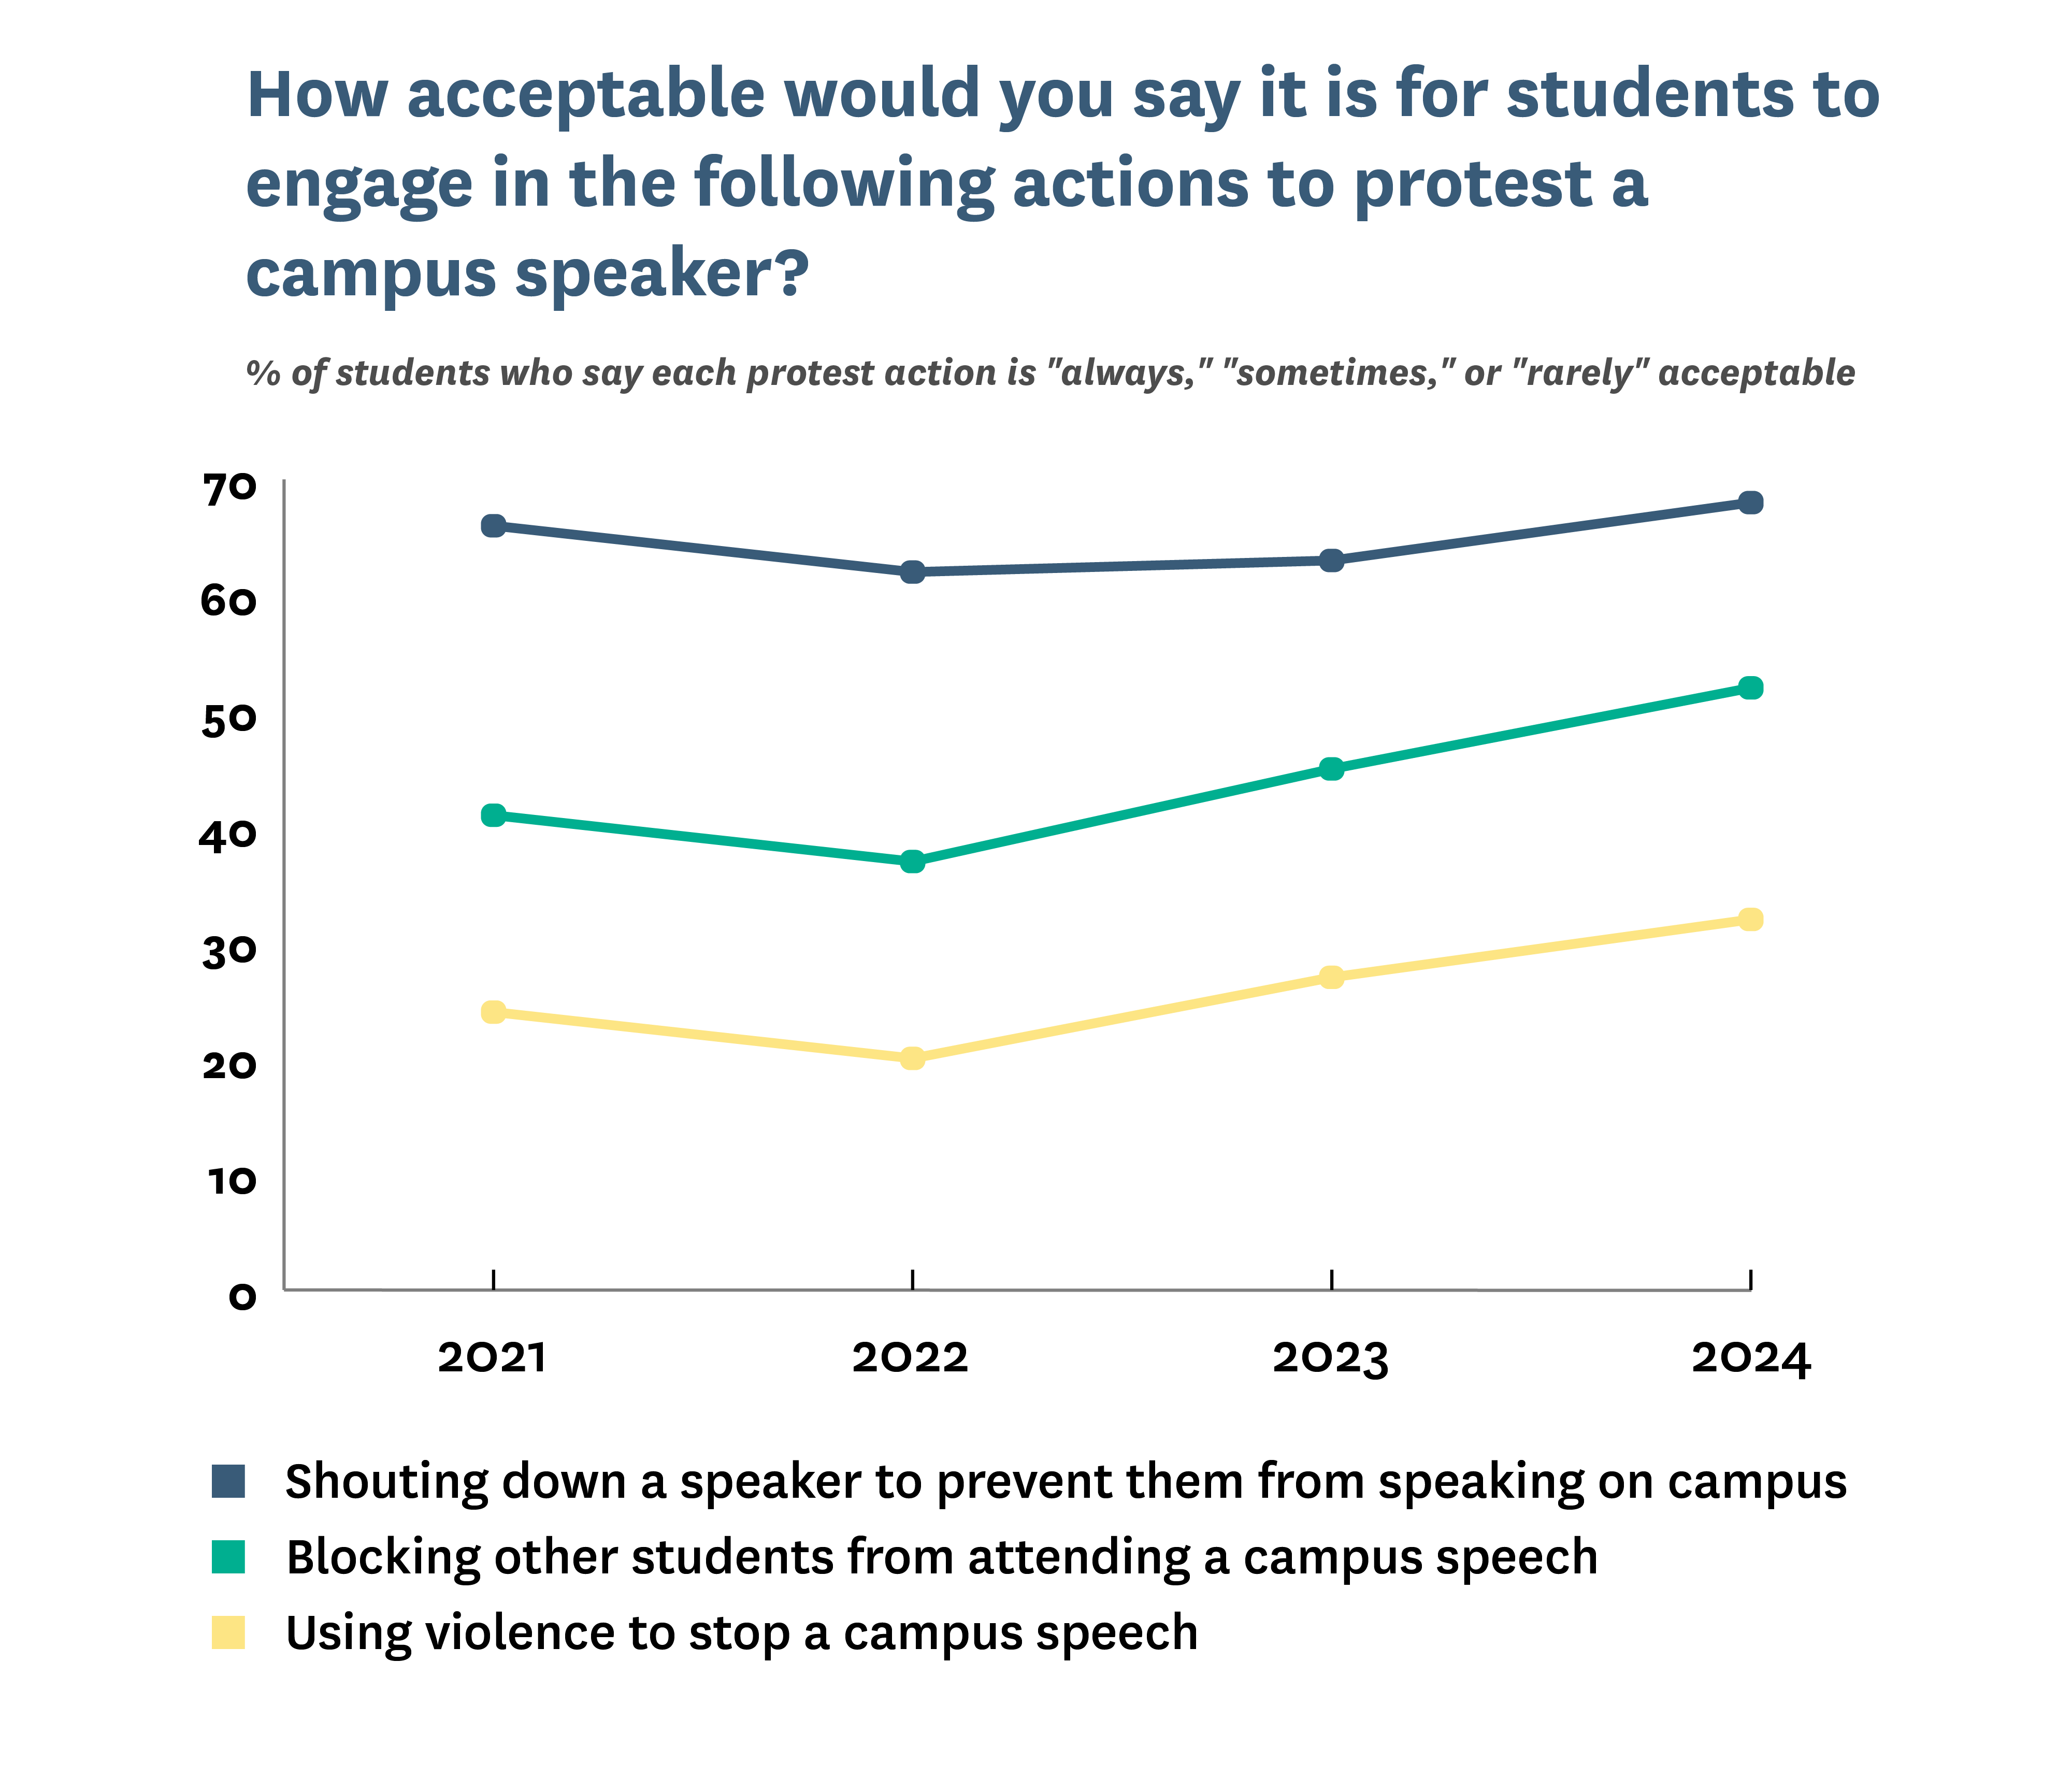
This year, just over half of students (52%) reported that blocking other students from attending a campus speech is at least “rarely” acceptable, up from 45% in 2023 and 37% in 2022. Even more concerning, about a third of students (32%) reported that using violence to stop a campus speech is at least “rarely” acceptable, up from 27% last year and 20% in 2022.
While shouting down a speaker is nonviolent, it is still disruptive and threatens free expression. Successful shoutdowns are examples of the “heckler’s veto” — when an individual or group “vetoes” a speech by severely and substantially disrupting it so that it cannot continue. This year, more than two-thirds of students (68%) said that shouting down a speaker is at least “rarely” acceptable, an increase from 63% last year and 62% in 2022.
Students’ political identification correlates with their level of acceptance of disruptive conduct.
Very liberal students were particularly accepting of disruptive behaviors:
- 84% of very liberal students said that shouting down a speaker is at least “rarely” acceptable.
- 66% of very liberal students said that blocking other students from attending a campus speech is at least “rarely” acceptable.
- 38% of very liberal students said that using violence to stop a campus speech is at least “rarely” acceptable.
How Tolerant Are Students of Controversial Speakers?
Each year, thousands of lectures and planned talks occur on college campuses across the country without incident. Some of these events spark controversy over the speakers’ views or previous remarks, leading students to attempt to get the speaker uninvited from speaking on campus. These deplatforming attempts can include demanding the silencing of speakers or those who invited them, calling for college officials to disinvite invited guest speakers, disrupting events, and even using violence to prevent expression from occurring.
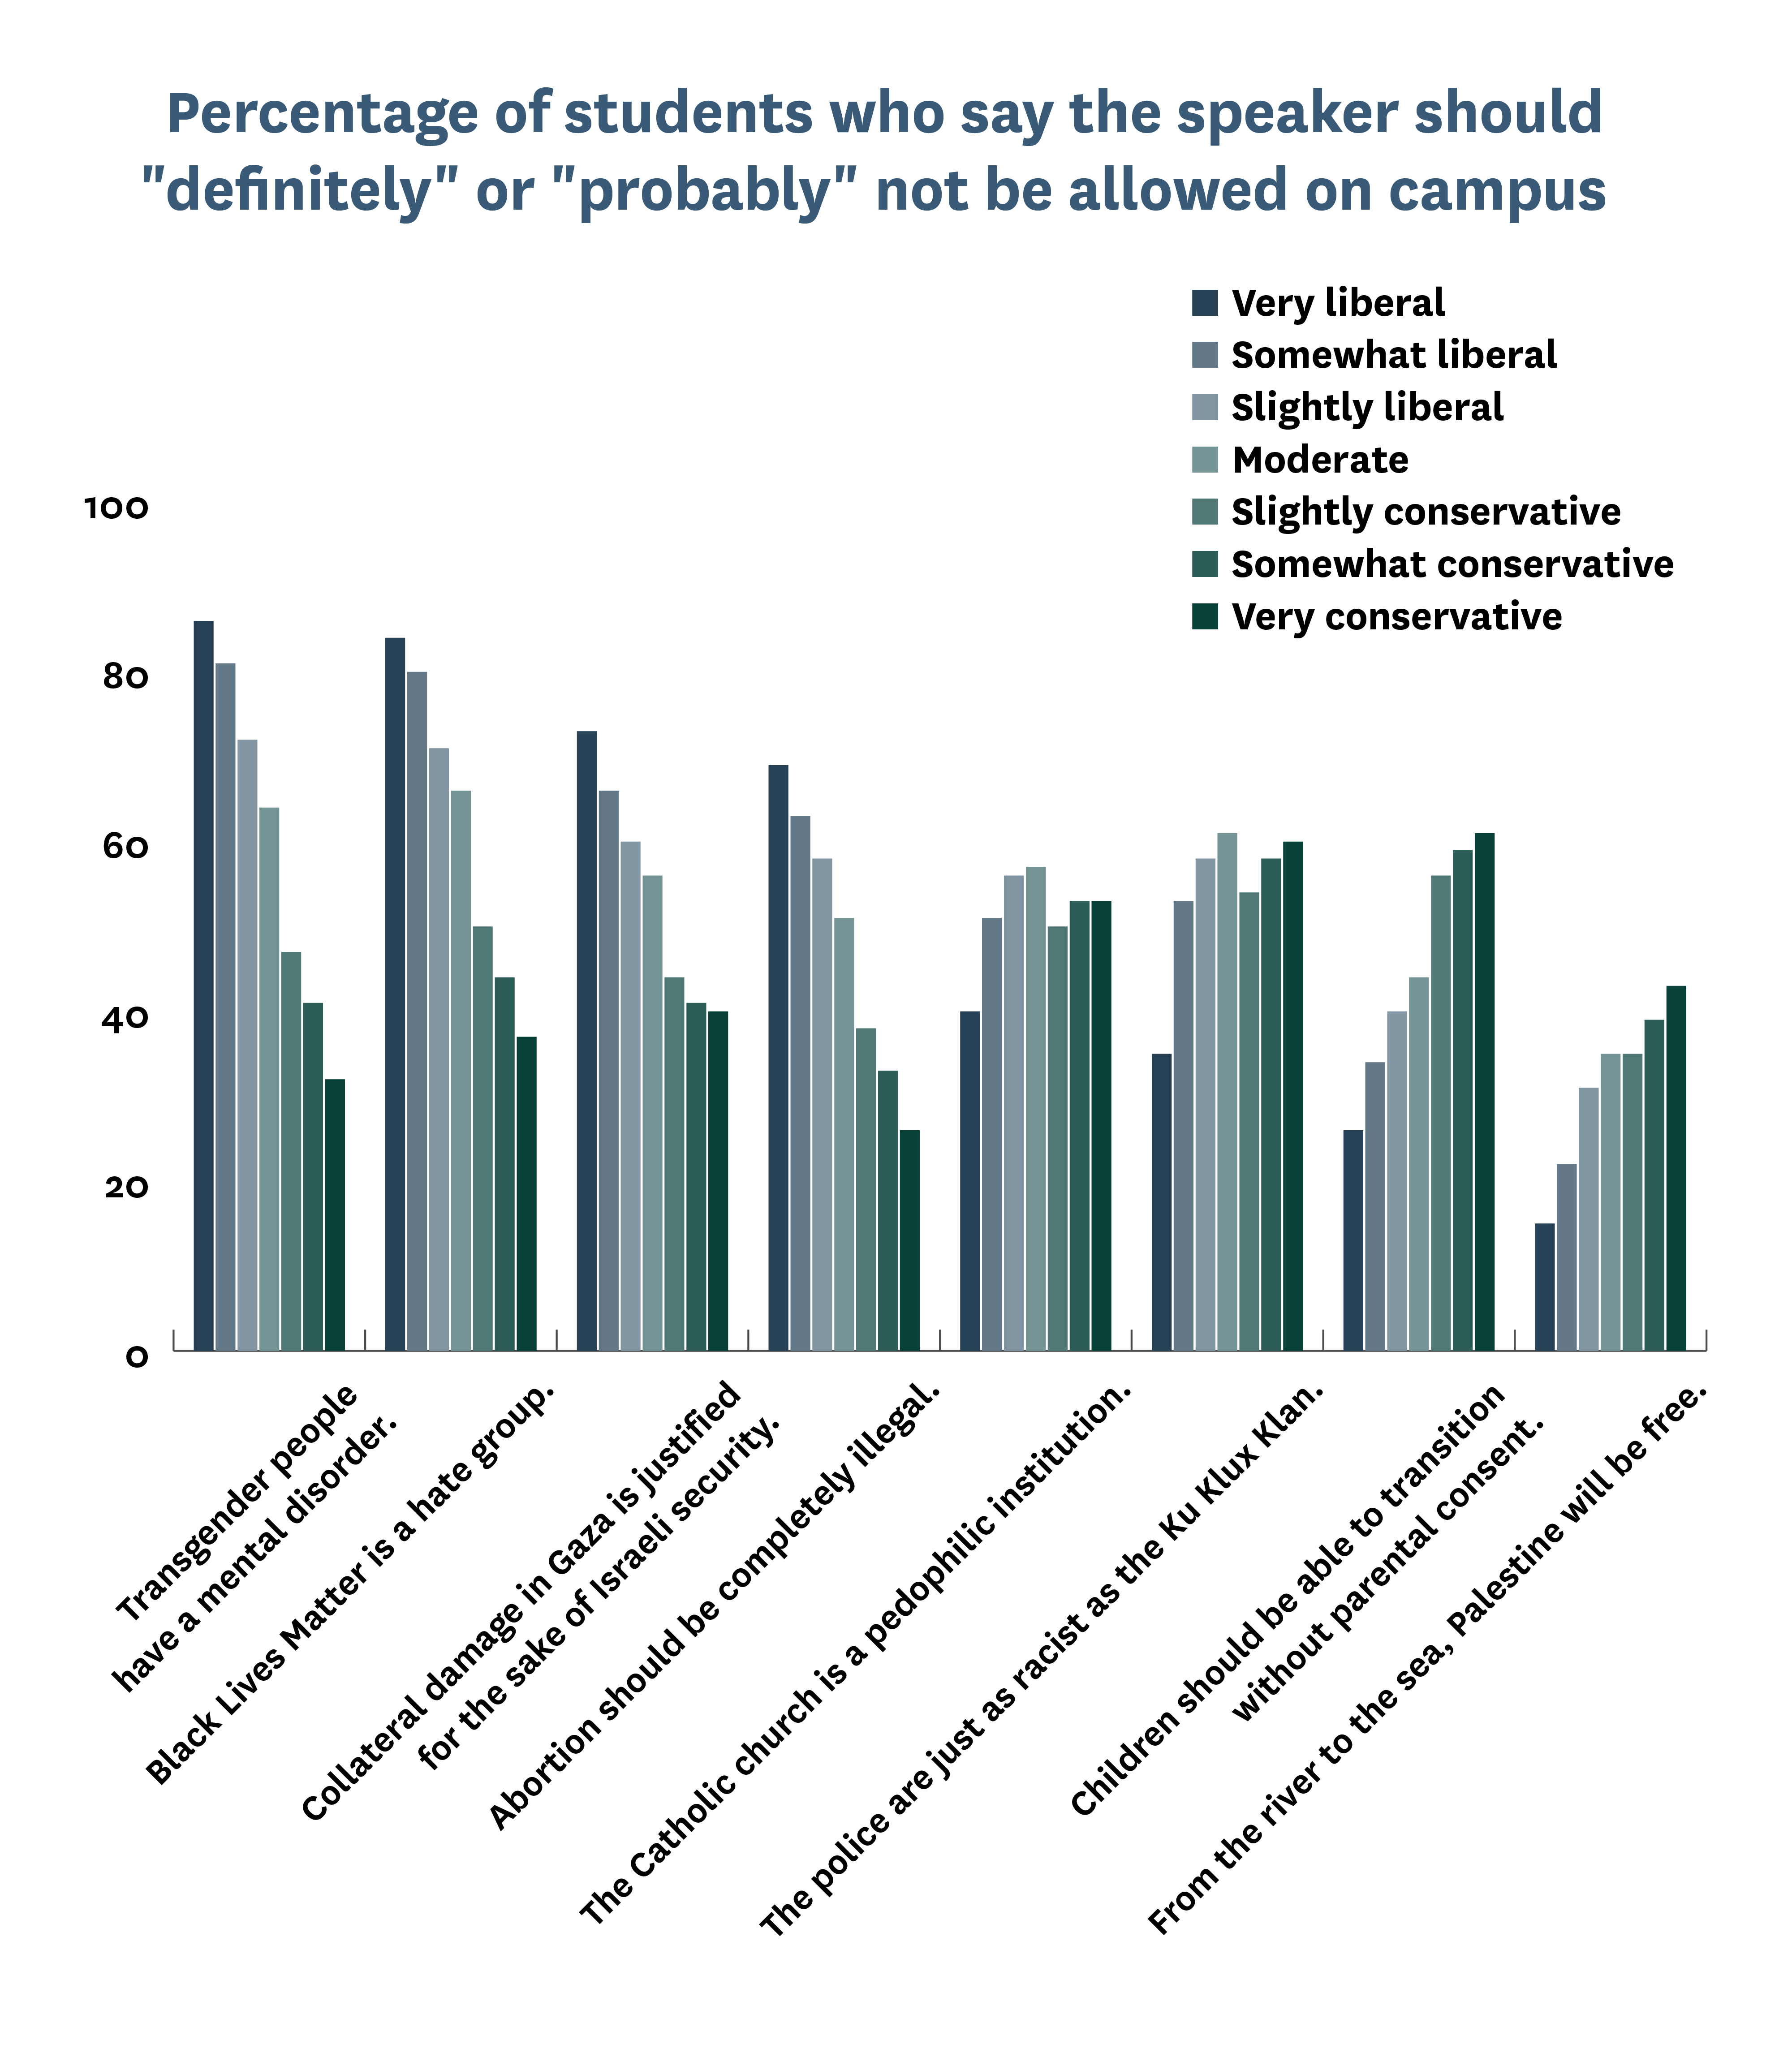
Political tolerance has long been assessed by asking people whether they would grant civil liberties — primarily freedom of speech — to nonconformists and controversial or offensive speakers.[32] Therefore, this survey asks students whether, regardless of their own views on the topic, their school should allow a speaker on campus who has expressed one of the following eight ideas:[33]
- “Abortion should be completely illegal.”
- “Black Lives Matter is a hate group.”
- “Transgender people have a mental disorder.”
- “The Catholic church is a pedophilic institution.”
- “The police are just as racist as the Ku Klux Klan.”
- “Children should be able to transition without parental consent.”
- “Collateral damage in Gaza is justified for the sake of Israeli security.”
- “From the river to the sea, Palestine will be free.”
Overall, a majority of students said that six of the eight speakers should “definitely” or “probably” not be allowed on campus. Roughly two-thirds of students opposed the speaker who said “Transgender people have a mental disorder” (68%), and the same percentage opposed the speaker who said “Black Lives Matter is a hate group.” At least half opposed the speakers who said the following:
- “The Catholic church is a pedophilic institution” (51%).
- “The police are just as racist as the Ku Klux Klan” (53%).
- “Collateral damage in Gaza is justified for the sake of Israeli security” (59%).
In contrast, 71% of students said that a speaker who said “From the river to the sea, Palestine will be free” should “definitely” or “probably” be allowed on campus, and 56% said the same about a speaker who said “Children should be able to transition without parental consent.”
Similar to the student responses on the different forms of disruptive conduct, student opposition to controversial speakers often correlated with political identity.
A majority of very liberal students said that all three controversial liberal speakers should “definitely” or “probably” be allowed on campus, with support ranging from 60% (“The Catholic church is a pedophilic institution”) to 74% (“Children should be able to transition without parental consent”). This is not the case for somewhat liberal students or slightly liberal students, a majority of whom opposed allowing on campus the speaker who said “The Catholic church is a pedophilic institution” and the speaker who said “The police are just as racist as the Ku Klux Klan.
Conclusions
We have good reason to be concerned about the state of free expression on American college and university campuses. Attempts to deplatform campus speakers for their expression are at record levels,[34] and a majority of college undergraduates oppose inviting controversial speakers to campus.[35] During the encampment protests students occupied buildings and attempted to disrupt a number of commencement ceremonies.[36] Before and after the start of these protests, administrators suppressed student and faculty speech and, in some cases, even called in police to arrest students.[37]
Many colleges’ Free Speech Rankings scores reflect their responses to these events.
For instance, some of the bottom ranked schools bungled their response to student protests. Stifling expression is not the answer, and arbitrarily applying speech code policies to punish students for some kinds of speech but not others undermines an administration’s credibility. This is reflected by the fact that many of the bottom ranked schools have poor “Administrative Support” scores. A deeper analysis of survey data collected during the encampment protests at Barnard College, Columbia University, and the University of Southern California found that student confidence that the administration protects free speech plummeted from before the start of the encampments to after the encampments were established.
Indiana University and the University of Texas at Austin both ranked in the bottom 10. At Indiana University, this followed reports of snipers stationed on the roofs of campus buildings after the administration called the police to shut down an encampment protest. At the University of Texas at Austin, it followed the university preemptively calling the police to campus, presumably to prevent students from establishing an encampment.[38] Both of these schools also have poor “Administrative Support” scores, ranking 240 and 228, respectively.
Contrast this with the top schools in the rankings. Encampment protests also occurred at many of these schools. However, they largely resisted the urge to punish students and faculty for their expression.
Beyond their responses to the encampments, many of the top schools have established a clear pattern of good behavior.
Not a single deplatforming has occurred at any of them since 2020, and sanctions of faculty and students are rare. The exception is Claremont McKenna, where three scholar sanctions occurred in quick succession in 2021 and 2022: These three sanctions are likely the only thing keeping Claremont McKenna out of the rankings’ top spot. The University of Virginia and Michigan Technological University rank 1 and 2, respectively, because on multiple occasions they clearly stood up for free speech on campus.
This year’s rankings not only capture the expression climate on U.S. college and university campuses, but also reflect current events. The results also reveal the utility of including additional campus behavioral metrics: data from FIRE’s Campus Deplatforming database, Scholars Under Fire database, and forthcoming Students Under Fire database.
Ultimately, these data send a clear message to college and university administrators: Leadership matters. Contrast the behavior of administrators at UVA and Michigan Tech with that of administrators at Barnard, Columbia, and Harvard.
Colleges and universities can do a lot to set the tone of the expression climate on campus. For starters, they can maintain clear policies that defend expressive rights, not ambiguous ones that administrators can apply arbitrarily whenever they see fit. With that said, maintaining clear speech-protective policies is not enough. Whether a school truly holds free expression as a core value is revealed when that school is tested by controversy.
If the past year is any indication, a lot of America’s colleges and universities are failing the test.
Appendices
Methodology
The College Free Speech Rankings survey was developed by FIRE and administered by College Pulse. No donors to the project took part in designing or conducting the survey. The survey was fielded from January 25 through June 17, 2024. These data come from a sample of 58,807 undergraduates who were then enrolled full-time in four-year degree programs at one of a list of 258 colleges and universities in the United States. The margin of error for the U.S. undergraduate population is +/- 0.4 of a percentage point, and the margin of error for college student sub-demographics ranges from 2-5 percentage points.
The initial sample was drawn from College Pulse’s American College Student Panel™, which includes more than 850,000 verified undergraduate students and recent alumni from schools within a range of more than 1,500 two- and four-year colleges and universities in all 50 states. Panel members were recruited by a number of methods to help ensure student diversity in the panel population. These methods include web advertising, permission-based email campaigns, and partnerships with university-affiliated organizations. To ensure the panel reflects the diverse backgrounds and experiences of the American college population, College Pulse recruited panelists from a wide variety of institutions. The panel includes students attending large public universities, small private colleges, online universities, historically Black colleges such as Howard University, women’s colleges such as Smith College, and religiously-affiliated colleges such as Brigham Young University.
College Pulse uses a two-stage validation process to ensure that all its surveys include only students currently enrolled in two-year or four-year colleges or universities. Students are required to provide an “.edu” email address to join the panel and, for this survey, had to acknowledge that they are currently enrolled full-time in a four-year degree program. All invitations to complete surveys were sent using the student’s “.edu” email address or through a notification in the College Pulse app, available on iOS and Android platforms.
College Pulse applies a post-stratification adjustment based on demographic distributions from multiple data sources, including the Current Population Survey (CPS), the National Postsecondary Student Aid Study (NPSAS), and the Integrated Postsecondary Education Data System (IPEDS). The “weight” rebalances the sample based on a number of important benchmark attributes, such as race, gender, class year, voter registration status, and financial aid status. The sample weighting is accomplished using an iterative proportional fitting (IFP) process that simultaneously balances the distributions of all variables to produce a representative sample of four year undergraduate students in the United States.
This year College Pulse introduced a similar post-stratification adjustment based on demographic distributions from multiple data sources, including the Current Population Survey (CPS), the National Postsecondary Student Aid Study (NPSAS), and the Integrated Postsecondary Education Data System (IPEDS). The “school universe weight” rebalances the sample based on a number of important benchmark attributes, such as race, gender, class year, voter registration status, and financial aid status. The sample weighting is accomplished using an iterative proportional fitting (IFP) process that simultaneously balances the distributions of all variables to produce a representative sample of four year undergraduate students from the 257 colleges and universities surveyed.
College Pulse also applies a post-stratification adjustment based on demographic distributions from the Current Population Survey (CPS), the National Postsecondary Student Aid Study (NPSAS), and the Integrated Postsecondary Education Data System (IPEDS). This “school weight” rebalances the sample from each individual school surveyed based on a number of important benchmark attributes, such as race, gender, class year, voter registration status, and financial aid status. The sample weighting is accomplished using an iterative proportional fitting (IFP) process that simultaneously balances the distributions of all variables to produce a representative sample of students at each individual school.
All weights are trimmed to prevent individual interviews from having too much influence on the final results and to ensure over-sampled population groups do not completely lose their voice.
The use of these weights in statistical analysis ensures that the demographic characteristics of the sample closely approximate the demographic characteristics of the target populations. Even with these adjustments, surveys may be subject to error or bias due to question wording, context, and order effects.
For further information, please see: https://collegepulse.com/methodology.
Free Speech Rankings
The College Free Speech Rankings are based on a composite score of 14 components, seven of which assess student perceptions of different aspects of the speech climate on their campus. The other seven assess behavior by administrators, faculty, and students regarding free expression on campus. Higher scores indicate a better campus climate for free speech and expression.
Student Perceptions
The student perception components include:
- Comfort Expressing Ideas: Students were asked how comfortable they feel expressing their views on controversial topics in five different campus contexts (e.g., “in class,” or “in the dining hall”). Options ranged from “very uncomfortable” to “very comfortable.” Responses were coded so that higher scores indicate greater comfort expressing ideas. The maximum number of points is 20.
- Self-Censorship: Students were provided with a definition of self-censorship and then asked how often they self-censored in three different contexts on campus (e.g., “in a classroom discussion”). Responses were coded so that higher scores indicate self-censoring less often. The maximum number of points is 15.[39]
- Tolerance for Liberal Speakers: Students were asked whether three speakers espousing views potentially offensive to conservatives (e.g., “The police are just as racist as the Ku Klux Klan.”) should be allowed on campus, regardless of whether they personally agree with the speaker’s message. Options ranged from “definitely should not allow this speaker” to “definitely should allow this speaker” and were coded so that higher scores indicate more tolerance of the speaker (i.e., more support for allowing the speaker on campus). The maximum number of points is 12.
- Tolerance for Conservative Speakers: Students were also asked whether three speakers espousing views potentially offensive to liberals (e.g., “Black Lives Matter is a hate group”) should be allowed on campus, regardless of whether they personally agree with the speaker’s message. Scoring was performed in the same manner as it was for the “Tolerance for Liberal Speakers” subcomponent, and the maximum number of points is 12.
- Disruptive Conduct: Students were asked how acceptable it is to engage in different methods of protest against a campus speaker, including “shouting down a speaker or trying to prevent them from speaking on campus,” “blocking other students from attending a campus speech,” and “using violence to stop a campus speech.” Options ranged from “always acceptable” to “never acceptable” and were coded so that higher scores indicate less acceptance of disruptive conduct. The maximum number of points is 12.
- Administrative Support: Students were asked how clear it is that their administration protects free speech on campus and how likely the administration would be to defend a speaker’s right to express their views if a controversy over speech occurred on campus. For the administrative clarity question, options ranged from “not at all clear” to “extremely clear,” and for the administrative controversy question, options ranged from “not at all likely” to “extremely likely.” Options were coded so that higher scores indicate greater clarity and a greater likelihood of defending a speaker’s rights. The maximum number of points is 10.
- Openness: Finally, students were asked which of 20 issues (e.g., “abortion,” “freedom of speech,” “gun control,” and “racial inequality”), if any, are difficult to have open conversations about on campus. Responses were coded so that higher scores indicate fewer issues being selected. The maximum number of points is 20.
Two additional constructs, “Mean Tolerance” and “Tolerance Difference,” were computed from the “Tolerance for Liberal/Conservative Speaker” components. “Tolerance Difference” was calculated by subtracting “Tolerance for Conservative Speakers” from “Tolerance for Liberal Speakers” and then taking the absolute value (so that a bias in favor of either side would be treated the same).
Campus Behavioral Metrics
Schools received bonus points — described in more detail below — for unequivocally supporting free expression in response to speech controversies by taking the following actions indicative of a positive campus climate for free speech:
- Supporting free expression during a deplatforming campaign, as recorded in FIRE’s Campus Deplatforming database.[40]
- Supporting a scholar whose speech rights were threatened during a free speech controversy, as recorded in FIRE's Scholars Under Fire database.[41]
- Supporting students and student groups, as recorded in the 2025 College Free Speech Rankings behavioral metrics documentation that is available online.[42]
Schools were penalized — described in more detail below — for taking the following actions indicative of poor campus climate for free speech:
- Successfully deplatforming a speaker, as recorded in FIRE’s Campus Deplatforming database.
- Sanctioning a scholar (e.g., placing under investigation, suspending, or terminating a scholar), as recorded in FIRE’s Scholars Under Fire database.
- Sanctioning a student or student groups, as recorded in the 2025 College Free Speech Rankings behavioral metrics documentation that is available online.
To be included in this year’s rankings, an incident that resulted in a bonus or penalty had to have been recorded by June 15, 2024, and had to have been fully assessed by FIRE’s research staff, who determined whether the incident warranted inclusion.
In response to the encampment protests, FIRE and College Pulse reopened the 2025 College Free Speech Rankings survey on any campus with an encampment. This allowed us to collect survey data from students while the encampments were taking place.[43] That means that this year’s College Free Speech Rankings provide a treasure trove of data on the evolving state of free expression at American colleges and universities.
FIRE’s Spotlight ratings — our ratings of the written policies governing student speech at nearly 500 institutions of higher education in the United States — also factored into each school's overall score. Three substantive ratings are possible: “red light,” “yellow light,” and “green light.” A “red light” rating indicates that the institution has at least one policy that both clearly and substantially restricts freedom of speech. A “yellow light” rating indicates that an institution maintains at least one policy that places a clear restriction on a more limited amount of protected expression, or one that, by virtue of vague wording, could too easily be used to restrict protected expression. A “green light” rating indicates that an institution maintains no policies that seriously threaten speech, although this rating does not indicate whether a college actively supports free expression.[44]
Finally, a fourth rating, “Warning,” is assigned to a private college or university when its policies clearly and consistently state that it prioritizes other values over a commitment to free speech. Warning schools, therefore, were not ranked, and their overall scores are presented separately in this report.[45]
For this year’s rankings, the cutoff date for assessing a school’s speech code policies was June 15, 2024. Any changes to a school’s Spotlight rating that occurred since then will be reflected in the 2026 College Free Speech Rankings.
Overall Score
To create an overall score for each college, we first summed the following student subcomponents: “Comfort Expressing Ideas,” “Self-Censorship,” “Mean Tolerance,” “Disruptive Conduct,” “Administrative Support,” and “Openness.” Then, we subtracted the “Tolerance Difference.” By including the “Mean Tolerance” (as opposed to including “Tolerance for Liberal Speakers” and “Tolerance for Conservative Speakers” separately) and subtracting the “Tolerance Difference,” the score accounted for the possibility that ideologically homogeneous student bodies may result in a campus that appears to have a strong culture of free expression but is actually hostile to the views of an ideological minority — whose views students may almost never encounter on campus.
Then, to further account for the speech climate on an individual campus, we incorporated behavioral components. A school earned two bonus points each time it unequivocally defended free expression during a campus speech controversy — a rating of “High Honors” for its public response to a speech controversy. For instance, when the student government at Arizona State University opposed a registered student group’s invitation to Mohammed el-Kurd to speak on campus, and other members of the campus community petitioned the university to disinvite el-Kurd, a university spokesperson responded:
The university is committed to a safe environment where the free exchange of ideas can take place . . . As a public university, ASU adheres to the First Amendment and strives to ensure the fullest degree of intellectual freedom and free expression. All individuals and groups on campus have the right to express their opinions, whatever those opinions may be, as long as they do not violate the student code of conduct, student organization policies, and do not infringe on another student’s individual rights.
el-Kurd spoke successfully on campus, and we awarded ASU two bonus points.
A school earned one bonus point for responding to a speech controversy by making a public statement that strongly defends the First Amendment but is not as full-throated a defense as a “High Honors” statement. These statements received the rating of “Honors.” For instance, at New York University, NYU Law Students for Palestine and Jewish Law Students for a Free Palestine called for the cancellation of an event featuring Robert Howse and Michal Cotler-Wunsh, because Cotler-Wunsh supports the occupation of Palestine. The event was co-sponsored by a student group, NYU’s Jewish Law Students Association, as well as the president's office and the Bronfman Center for Jewish Life. NYU did not cancel the event, and protesters interrupted Cotler-Wunsh several times during his remarks before voluntarily leaving, allowing the event to resume and conclude successfully. The dean of the law school said the following in response:
The principles of free speech and inquiry are complemented by debate, challenge and protest . . . While dissent may be vigorous, it must not interfere with the speaker’s ability to communicate — which is exactly why, should those interrupters not have left on their own accord, they would be subject to discipline.
We awarded one point for this response, which occurred in 2024, then we set this bonus to decrease by one-quarter of a point for each year that passes.
We also applied penalties when a school sanctioned a scholar, student, or student group, or deplatformed a speaker.
A school lost up to five points each time it sanctioned (e.g., investigated, suspended, or terminated) a scholar. When the sanction did not result in termination the school received a penalty of one point, which we set to decrease by one-quarter of a point each year: This meant penalizing a school a full point for sanctioning a scholar in 2024, three-quarters of a point for sanctioning a scholar in 2023, half a point for sanctioning a scholar in 2022, and one-quarter of a point for sanctioning a scholar in 2021. However, if the administration terminated the scholar, we subtracted three points, and if that scholar was tenured, we subtracted five points. We applied full penalties for termination for four years, then set them to decline by one-quarter of a point each year. So, a penalty for termination that occurred in 2020 has just now started to decay.
A school lost up to three points for sanctioning students or student groups. When the sanction did not result in expulsion, the revocation of acceptance, the denial or revoking of recognition, suspension, or termination of a student’s campus employment (e.g, as a resident assistant) the school received a penalty of one point. Like with scholar sanctions that did not result in termination, we set these penalties to decrease by one-quarter of a point each year. If a school suspended a student or terminated their campus employment, we penalized it two points. We also set these penalties to decrease by one-quarter of a point each year. However, if a school denied or revoked a student group’s recognition, expelled a student, or revoked their acceptance, it was penalized three points. We applied these penalties in full for four years, then set them to decline by one-quarter of a point each year.
Regarding deplatforming attempts, a school was penalized one point if an invited speaker withdrew because of the controversy caused by their upcoming appearance on campus or if an event was postponed in response to a controversy. We set this penalty to decrease by a quarter of a point each year. Schools where an attempted disruption occurred received a penalty of two points. We applied this penalty for four years, then set it to decrease by one-quarter of a point each year. Schools with deplatforming attempts that resulted in an event cancellation, a preemptive rejection of a speaker, the removal of artwork on display, the revocation of a speaker’s invitation, or a substantial event disruption were penalized three points. We applied these penalties in full for four years, then set them to decline by one-quarter of a point each year.
After we applied bonuses and penalties, we standardized each school’s score by group — Warning schools and other schools — making the average score in each group 50.00 and the standard deviation 10.00. Following standardization, we added one standard deviation to the final score of colleges who received a green light rating for their speech codes. We also subtracted half a standard deviation from the final score of colleges that received a yellow light rating, one standard deviation from the final score of schools that received a red light rating, and two standard deviations from schools that received a Warning rating.
Overall Score = (50 + (ZRaw Overall Score)(10)) + FIRE Rating
Campus Speech Controversies
Deplatforming Attempts
FIRE’s Campus Deplatforming database documents efforts to censor invited speakers, artwork, film screenings, or performances (e.g., comedy shows, plays) on public and private American college and university campuses from 1998-present. Schools included in the rankings received bonuses for unequivocally defending free expression during a deplatforming campaign from 2020-mid-2024. They received penalties for successfully deplatforming a speaker or for being the site of a substantial event disruption (when one or more people unsuccessfully attempt to disrupt an event, entirely prevent a speaker from speaking, or prevent an audience from hearing the speaker) within the same time frame.[46]
At the schools surveyed, a total of 102 successful deplatforming incidents (60%) occurred. They include:[47]
- 45 substantial event disruptions, when one or more people substantially disrupt or entirely prevent a speaker from speaking or prevent an audience from hearing the speaker.
- 36 revocations, when a speaker’s invitation is rescinded.
- Six rejections, when a school or the student government preemptively rejects a speaker.
- Seven withdrawals, when a speaker cancels an event in response to a disinvitation campaign.
- Three postponements, when an event is postponed to a later date due to controversy.
- Six cancellations of performances or film screenings.
- Two removals of displayed artwork.
All of these deplatforming incidents negatively impacted a school's overall score.
FIRE also recorded 44 attempted disruptions at the 257 schools surveyed. These incidents also negatively impacted a school's overall score.
The 102 successful deplatforming attempts occurred on 71 of the 257 campuses. Harvard University and New York University, two of the lowest ranked schools, experienced four successful deplatformings each. Dartmouth College, Syracuse University, the University of Houston, the University of New Mexico, and the University of Southern California each experienced three successful deplatformings since 2020.
The following 21 schools were each the site of more than one successful deplatforming incident and altogether account for 53 of the 102 successful deplatforming attempts (52%). A number of these schools — Barnard College, Harvard, NYU, Syracuse, the University of Pennsylvania, and USC — also rank in the bottom 10 of this year’s College Free Speech Rankings with either a “Very Poor” or “Abysmal” speech climate:
- Harvard University
- New York University
- Dartmouth College
- Syracuse University
- University of Houston
- University of New Mexico
- University of Southern California
- Barnard College
- Brown University
- Indiana University
- Pennsylvania State University
- San Jose State University
- University of California, Berkeley
- University of California, Davis
- University of California, Los Angeles
- University of Florida
- University of Michigan
- University of Pennsylvania
- University of Pittsburgh
- University of Utah
- University of Vermont
Harvard University also experienced four attempted disruptions since 2020. Only seven other schools experienced more than one attempted disruption in this time frame. The University of Iowa experienced three attempted disruptions, and Columbia University, Michigan State University, Stanford University, Tufts University, the University of North Carolina at Chapel Hill, and the University of Texas at Austin each experienced two attempted disruptions.
We recorded 29 instances of schools supporting free expression in response to a deplatforming campaign. In all of these instances a school received a bonus that either positively impacted its overall score or mitigated the damage done to its score by a successful deplatforming attempt.
Only Georgetown University and the University of Virginia unequivocally defended free expression during more than one deplatforming campaign, and they received multiple bonuses in the rankings for doing so.
Scholars Under Fire
FIRE’s Scholars Under Fire database covers expression-related incidents from 2000-present. It documents how and why scholars faced calls for sanction, how scholars and administrators responded, and what (if any) sanctions scholars experienced. Schools included in the rankings received bonuses or penalties based on their responses to these kinds of controversies from 2020-mid-2024.[48]
At the schools surveyed, a total of 148 scholar sanctions occurred. They include:
- 37 scholars who were terminated.
- 11 scholars who resigned.
- 26 scholars who were suspended.
- 10 scholars who were demoted.
- 36 scholars who were censored.
- Three scholars who were required to undergo training.
- 25 scholars who were investigated.[49]
Each of these incidents negatively impacted a school's overall score. On 11 occasions, a college or university unequivocally defended a scholar’s free expression in response to a sanction attempt. These incidents positively impacted a school’s overall score.
The 148 scholar sanctions occurred on 83 of the 257 campuses surveyed. Since 2020, eight scholar sanctions occurred at Columbia University, six occurred at Harvard University, and five occurred at George Washington University. The following 14 schools were each the site of three or more scholar sanctions and altogether accounted for 61 of the 148 scholar sanctions that factored into the College Free Speech Rankings (43%):
- Columbia University
- Harvard University
- George Washington University
- Indiana University
- University of Central Florida
- University of Pennsylvania
- University of Texas at Austin
- Yale University
- Claremont McKenna College
- Emory University
- New York University
- Texas A&M University
- University of California, Los Angeles
- University of North Carolina at Chapel Hill
As with successful deplatformings, a number of these schools — Columbia, Harvard, NYU, IU, and Penn — also landed in the bottom 10 of the rankings with a “Poor,” “Very Poor” or “Abysmal” speech climate.
We recorded 12 instances of schools supporting free expression in response to a scholar sanction attempt. In all of these instances, a school received a bonus that positively impacted its overall score.
The University of California, Berkeley, is the only school that supported a scholar’s free expression on more than one occasion. The following schools supported a scholar’s free expression on one occasion: Boise State University, George Washington University, Princeton University, Stanford University, Syracuse University, the University of Michigan, the University of North Carolina at Chapel Hill, the University of Virginia, and Yale University.
Students Under Fire
FIRE’s Students Under Fire database covers expression-related incidents from 2020-present. It documents how and why students or student groups faced calls for sanction, how administrators responded, and what (if any) sanctions students experienced. Schools included in the rankings received bonuses or penalties based on their responses to these kinds of controversies from 2020-mid-2024.[50]
At the colleges surveyed, a total of 204 student sanctions occurred. They include:
- Four students who were expelled.
- Six students whose acceptance to the school or scholarship was revoked.
- 10 student groups whose recognition was denied or rescinded.
- 21 students or student groups who were suspended.
- 73 students or student groups who were censored.
- 62 students or student groups who were placed under investigation.
- Seven students who were required to undergo training or issue an apology or other statement.
- Three students who were terminated from their campus employment.
- 18 students or student groups whose sanctions were issued by the student government.
Each of these incidents negatively impacted a school's overall score.
The 204 student sanctions occurred on 107 of the 257 campuses surveyed. Since 2020, Syracuse University has sanctioned seven students or student groups. In the same time frame, Harvard University sanctioned six students or student groups, and Stanford University sanctioned five. The following seven schools were the site of four or more student sanctioning incidents since 2020:
- Syracuse University
- Harvard University
- Stanford University
- American University
- New York University
- Northwestern University
- University of Utah
As with successful deplatformings and scholar sanctions, a number of these schools — Harvard, NYU, and Syracuse — also landed in the bottom 10 of this year’s College Free Speech Rankings with either a “Very Poor” or “Abysmal” speech climate.
Another 16 schools were the site of three student sanctioning incidents since 2020. This group of schools includes three more bottom-10 schools: Columbia University, the University of Pennsylvania, and Indiana University.
We recorded 14 instances of schools supporting free expression in response to a student sanctioning attempt. In all of these instances, we awarded the school a bonus that positively impacted its overall score or mitigated the impact of a penalty it incurred. Arizona State University, which ranks 14, received three bonuses for its defense of student expression. Other notable schools that actively defended student free expression include the University of North Carolina at Greensboro, which ranks 22, and the top two schools in the rankings, the University of Virginia and Michigan Technological University.
Survey Questions and Topline Results
How clear is it to you that your college administration protects free speech on campus?
7% Not at all clear
17% Not very clear
42% Somewhat clear
27% Very clear
7% Extremely clear
If a controversy over offensive speech were to occur on your campus, how likely is it that the administration would defend the speaker’s right to express their views?
7% Not at all likely
21% Not very likely
47% Somewhat likely
20% Very likely
5% Extremely likely
How comfortable would you feel doing the following on your campus? [Presented in randomized order]
Publicly disagreeing with a professor about a controversial political topic.
33% Very uncomfortable
36% Somewhat uncomfortable
23% Somewhat comfortable
9% Very comfortable
Expressing disagreement with one of your professors about a controversial political topic in a written assignment.
25% Very uncomfortable
35% Somewhat uncomfortable
29% Somewhat comfortable
11% Very comfortable
Expressing your views on a controversial political topic during an in-class discussion.
20% Very uncomfortable
33% Somewhat uncomfortable
34% Somewhat comfortable
13% Very comfortable
Expressing your views on a controversial political topic to other students during a discussion in a common campus space such as a quad, dining hall, or lounge.
17% Very uncomfortable
32% Somewhat uncomfortable
35% Somewhat comfortable
14% Very comfortable
Expressing an unpopular political opinion to your fellow students on a social media account tied to your name.
33% Very uncomfortable
34% Somewhat uncomfortable
24% Somewhat comfortable
9% Very comfortable
On your campus, how often have you felt that you could not express your opinion on a subject because of how students, a professor, or the administration would respond?
17% Never
38% Rarely
28% Occasionally, once or twice a month
12% Fairly often, a couple of times a week
5% Very often, nearly every day
This next series of questions asks you about self-censorship in different settings. For the purpose of these questions, self-censorship is defined as follows:
Refraining from sharing certain views because you fear social (e.g., exclusion from social events), professional (e.g., losing job or promotion), legal (e.g., prosecution or fine), or violent (e.g., assault) consequences, whether in person or remotely (e.g., by phone or online), and whether the consequences come from state or non-state sources.
How often do you self-censor during conversations with other students on campus?
12% Never
33% Rarely
31% Occasionally, once or twice a month
17% Fairly often, a couple of times a week
6% Very often, nearly every day
How often do you self-censor during conversations with your professors?
12% Never
33% Rarely
30% Occasionally, once or twice a month
17% Fairly often, a couple of times a week
8% Very often, nearly every day
How often do you self-censor during classroom discussions?
11% Never
32% Rarely
32% Occasionally, once or twice a month
18% Fairly often, a couple of times a week
8% Very often, nearly every day
How acceptable would you say it is for students to engage in the following action to protest a campus speaker? [Presented in randomized order]
Shouting down a speaker to prevent them from speaking on campus.
7% Always acceptable
30% Sometimes acceptable
32% Rarely acceptable
32% Never acceptable
Blocking other students from attending a campus speech.
4% Always acceptable
18% Sometimes acceptable
29% Rarely acceptable
48% Never acceptable
Using violence to stop a campus speech.
3% Always acceptable
11% Sometimes acceptable
18% Rarely acceptable
68% Never acceptable
Student groups often invite speakers to campus to express their views on a range of topics. Regardless of your own views on the topic, should your school ALLOW or NOT ALLOW a speaker on campus who promotes the following idea? [Presented in randomized order]
Transgender people have a mental disorder.
37% Definitely should not allow this speaker
31% Probably should not allow this this speaker
20% Probably should allow this speaker
12% Definitely should allow this speaker
Abortion should be completely illegal.
25% Definitely should not allow this speaker
28% Probably should not allow this this speaker
30% Probably should allow this speaker
15% Definitely should allow this speaker
Black Lives Matter is a hate group.
36% Definitely should not allow this speaker
33% Probably should not allow this this speaker
21% Probably should allow this speaker
11% Definitely should allow this speaker
The Catholic church is a pedophilic institution.
17% Definitely should not allow this speaker
34% Probably should not allow this this speaker
33% Probably should allow this speaker
15% Definitely should allow this speaker
The police are just as racist as the Klu[sic] Klux Klan.
20% Definitely should not allow this speaker
33% Probably should not allow this this speaker
32% Probably should allow this speaker
15% Definitely should allow this speaker
Children should be able to transition without parental consent.
15% Definitely should not allow this speaker
28% Probably should not allow this this speaker
38% Probably should allow this speaker
18% Definitely should allow this speaker
Collateral damage in Gaza is justified for the sake of Israeli security.
26% Definitely should not allow this speaker
34% Probably should not allow this this speaker
28% Probably should allow this speaker
12% Definitely should allow this speaker
From the river to the sea, Palestine will be free.
8% Definitely should not allow this speaker
20% Probably should not allow this this speaker
43% Probably should allow this speaker
28% Definitely should allow this speaker
Some students say it can be difficult to have conversations about certain issues on campus. Which of the following issues, if any, would you say are difficult to have an open and honest conversation about on your campus? [Percentage selecting each option]
45% Abortion
24% Affirmative action
13% China
14% Climate change
16% Crime
22% Economic inequality
22% Freedom of speech
31% Gay rights
29% Gender inequality
36% Gun control
29% Hate speech
27% Immigration
54% The Israeli/Palestinian conflict
31% The Presidential Election
31% Police misconduct
36% Racial inequality
34% Religion
29% Sexual assault
14% The Supreme Court
41% Transgender rights
12% None of the above
Note: The survey asked additional questions that were not included in the calculation of the College Free Speech Rankings. The data for these questions will be released in a separate set of analyses.
Notes
[1] Lukianoff, G. & Stevens, S. (March 12, 2024). The skeptics were wrong, Part 1: Campus free speech was in trouble in 2018, and the data shows it has gotten much worse. Available online: https://greglukianoff.substack.com/p/the-skeptics-were-wrong-part-1;
Lukianoff, G. & Stevens, S (March 21, 2024). The skeptics were wrong, part 2: When it comes to free speech, the college kids are not alright. Available online: https://greglukianoff.substack.com/p/the-skeptics-were-wrong-part-2;
Stevens, S. (April 12, 2024). Deplatforming attempts are surging in 2024: Buckle up, folks. It’s not even disinvitation season yet. Available online: https://www.thefire.org/news/deplatforming-attempts-are-surging-2024.
[2] Appleby, J. (July 11, 2024). University of Florida suspends student for three years over peaceful protest: In response to campus protests related to the Israeli-Palestinian conflict, UF made up unlawful rules to punish students for protected expression.Available online: https://www.thefire.org/news/university-florida-suspends-student-three-years-over-peaceful-protest; Coward, T. (July 2, 2024). House Oversight Committee continues chilling investigation into student groups and nonprofits. Available online: https://www.thefire.org/news/house-oversight-committee-continues-chilling-investigation-student-groups-and-nonprofits; Shibley, R. (June 2, 2024). Fed investigation of Lafayette College over Israel-Hamas protests highlights new threat to free speech. Available online: https://www.thefire.org/news/fed-investigation-lafayette-college-over-israel-hamas-protests-highlights-new-threat-free.
[3] Appleby J. & Piro, G. (December 18, 2023). More colleges threaten to restrict speech in wake of Penn president’s resignation: Institutions abandon their free speech protections at students’ peril. Available online: https://www.thefire.org/news/more-colleges-threaten-restrict-speech-wake-penn-presidents-resignation; Eduardo, A. (January 2, 2024). In the aftermath of Claudine Gay's resignation, here's how Harvard can reform itself: With the loss of its president, America’s worst college for free speech is at another crossroads. Available online: https://www.thefire.org/news/aftermath-claudine-gays-resignation-heres-how-harvard-can-reform-itself.
[4] Alonso, J. (April 24, 2024). Why Are Students Camping on University Lawns? A new wave of campus protests has hit institutions from California to Massachusetts, many emboldened by arrests at Columbia University. Available online: https://www.insidehighered.com/news/students/free-speech/2024/04/24/students-set-encampments-coast-coast.
[5] FIRE (June 20, 2024). POLL: Americans oppose campus protesters defacing property, occupying buildings. Available online: https://www.thefire.org/news/poll-americans-oppose-campus-protesters-defacing-property-occupying-buildings.
[6] 6. Honeycutt, N. (June 11, 2024). Confidence in colleges and universities hits new lows, per FIRE polls: Young people, women, and Democrats reported the largest drops. Available online: https://www.thefire.org/news/confidence-colleges-and-universities-hits-new-lows-fire-polls.
[7] Schools were not penalized for how they handled the encampment protests. As this report demonstrates, the impact of the encampment protests on the campus speech climate is captured by responses to survey questions that ask students about their confidence in that their college administration protects speech rights on campus, their comfort expressing controversial political views, and how frequently they self-censor. Deplatformings that occurred during the encampment protests were also still included in the calculation of the 2025 College Free Speech Rankings.
[8] Harvard’s actual score was -21.50, Columbia’s was -0.53. Both scores were rounded up to 0.00.
[9] FIRE’s documentation of speech controversies that impacted the 2025 College Free Speech Rankings is available online: https://www.thefire.org/sites/default/files/2024/08/2025-CFSR-Behavioral-Metrics-FINAL.xlsx.
[10] The mean “Administrative Support” score for the top five schools (M = 6.30, S.D. = 0.19) is significantly higher than the mean “Administrative Support” score for the bottom schools (M = 5.05, S.D. = 0.49), t(8) = 5.26, p < .0001.
[11] The average of the top five schools’ “Comfort Expressing Ideas” score (M = 11.76, S.D. = 0.50) is significantly higher than the average “Comfort Expressing Ideas” score for the bottom five schools (M = 10.61, S.D. = 0.61), t(8) = 5.26, p = .01. The average of the top five schools’ “Tolerance Difference” score (M = 0.61, S.D. = 0.42) is significantly lower than the average “Tolerance Difference” score for the top bottom schools (M = 1.53, S.D. = 0.45), t(8) = -4.03, p < .01.
[12] FIRE (February 13, 2024). 10 Worst Censors: 2024. Available online: https://www.thefire.org/news/10-worst-censors-2024.
[13] Colleges whose speech policies received a “Warning” rating from FIRE were given a rank of Warning (see Methodology, available in the Appendix). We do, however, present their overall scores in this report. These scores were standardized separately from non-Warning schools so that the overall scores of Warning schools were computed only in comparison to one another. As a result, 251 schools are ranked this year.
[14] Prasad, V. (February 22, 2024). What is happening to medical students? Shouting down speakers reaches the University of Chicago. Available online: https://www.drvinayprasad.com/p/what-is-happening-to-medical-students.
[15] Coyne, J. (November 18, 2023). Violating University of Chicago speech regulations, pro-Palestinian students shout down Jewish students and shut down their speeches; University does nothing to stop the disruption. Available online: https://whyevolutionistrue.com/2023/11/18/violating-university-of-chicago-speech-regulations-pro-palestinian-students-shout-down-jewish-students-and-shut-down-their-speeches-university-does-nothing-to-stop-the-disruption/.
[16] President Alivisatos’s statement is available online: https://president.uchicago.edu/from-the-president/messages/231101-enormous-gifts-and-great-responsibilities.
[17] FIRE (March 21, 2024). Virginia Commonwealth University earns top rating for free speech. Available online: https://www.thefire.org/news/virginia-commonwealth-university-earns-top-rating-free-speech; FIRE (June 11, 2024). University of South Carolina earns top rating for free speech. Available online: https://www.thefire.org/news/university-south-carolina-earns-top-rating-free-speech.
[18] 18. Stevens, S., & Schwictenberg, A. (2020). 2020 College Free Speech Rankings: What’s the Climate for Free Speech on America’s College Campuses? Available online: https://www.thefire.org/research-learn/2020-college-free-speech-rankings; Stevens, S., & Schwictenberg, A. (2021). 2021 College Free Speech Rankings: What’s the Climate for Free Speech on America’s College Campuses? Available online: https://www.thefire.org/research-learn/2021-college-free-speech-rankings; Stevens, S.T. (2022). 2022-2023 College Free Speech Rankings: What Is the State of Free Speech on America’s College Campuses? The Foundation for Individual Rights and Expression. Available online: https://www.thefire.org/research-learn/2022-2023-college-free-speech-rankings;
Stevens, S.T. (2023). 2024 College Free Speech Rankings: What Is the State of Free Speech on America’s College Campuses? The Foundation for Individual Rights and Expression. Available online:
https://www.thefire.org/research-learn/2024-college-free-speech-rankings.
[19] FIRE (February 13, 2024). 10 Worst Censors: 2024. The Foundation for Individual Rights and Expression. Available online: https://www.thefire.org/news/10-worst-censors-2024.
[20] A full list of all the student sanction attempts that impacted the 2025 College Free Speech Rankings is available here: https://www.thefire.org/sites/default/files/2024/08/2025-CFSR-Behavioral-Metrics-FINAL.xlsx. The full Students Under Fire database is currently internal to FIRE but will be released in full in early 2025.
[21] Huddleston, S. & Mendell, C. (November 10, 2023). Columbia suspends SJP and JVP following ‘unauthorized’ Thursday walkout. Available online: https://www.columbiaspectator.com/news/2023/11/10/columbia-suspends-sjp-and-jvp-following-unauthorized-thursday-walkout/.
[22] Costescu, J. (March 25, 2024). At Columbia, an Israeli-Designated Terror Group Teaches 'Palestinian Resistance 101'—And Lauds Plane Hijackings. Available online: https://freebeacon.com/campus/at-columbia-an-israeli-designated-terror-group-teaches-palestinian-resistance-101-and-lauds-plane-hijackings/.
[23] A full list of all the student sanction attempts that impacted the 2025 College Free Speech Rankings is available here: https://www.thefire.org/sites/default/files/2024/08/2025-CFSR-Behavioral-Metrics-FINAL.xlsx. The full Students Under Fire database is currently internal to FIRE but will be released in full in early 2025.
[24] See FIRE’s Campus Deplatforming database, available online: https://www.thefire.org/research-learn/campus-deplatforming-database.
[25] Hernandez, A.O. & Kaleem, J. (April 19, 2024). USC cancels appearance by director Jon Chu, others amid valedictorian controversy. Available online: https://www.latimes.com/california/story/2024-04-19/usc-axes-high-profile-guest-speaker-from-commencement-lineup-amid-backlash-over-cancelled-valedictorian-speech.
[26] Zanger, J., Dhaliwal, N., & Saeidi, M. (May 6, 2024). Columbia University cancels main 2024 commencement ceremony, will host multiple ceremonies instead. Available online: https://www.cbsnews.com/newyork/news/columbia-university-commencement-2024/.
[27] Morey, A. (April 17, 2024). USC canceling valedictorian’s commencement speech looks like calculated censorship. Available online: https://www.thefire.org/news/usc-canceling-valedictorians-commencement-speech-looks-calculated-censorship.
[28] Chow, V. (April 19, 2024). USC cancels all commencement speakers amid valedictorian speech controversy. Available online: https://ktla.com/news/local-news/usc-cancels-all-commencement-speakers-amid-valedictorian-speech-controversy/; The University of Southern California’s official statement is available online: https://commencement.usc.edu/2024/04/19/commencement-update-april-19-2024/.
[29] Student responses to this question were not incorporated into a school’s overall score for the College Free Speech Rankings.
[30] Self-censorship was defined as the act of refraining from sharing certain views because you fear social (e.g., exclusion from social events), professional (e.g., losing a job or promotion), legal (e.g., prosecution or fine), or violent (e.g., assault) consequences, whether in-person or remotely (e.g., by phone or online), whether the feared consequences come from state or non-state sources.
[31] Student responses to these three questions were incorporated into a school’s overall score for the College Free Speech Rankings.
[32] Gibson, J. (2006). Enigmas of intolerance: Fifty years after Stouffer’s Communism, Conformity, and Civil Liberties. Perspectives on Politics, 4, 21–34; Stouffer, S. A. (1955). Communism, conformity, and civil liberties: A cross-section of the nation speaks its mind. Transaction Publishers; Sullivan, J. L.; Piereson, J.; & Marcus, G. E. (1979). An alternative conceptualization of political tolerance: Illusory increases 1950s–1970s. American Political Science Review, 73, 781–794; Sullivan, J. L.; Piereson, J.; & Marcus, G. E. (1982). Political Tolerance and American Democracy. University of Chicago Press.
[33] Student responses to two of the eight speakers — those who expressed that “Collateral damage in Gaza is justified for the sake of Israeli security” or that “From the river to the sea, Palestine will be free” — were not incorporated into a school’s overall score for the College Free Speech Rankings.
[34] Lukianoff, G. & Stevens, S. (March 12, 2024). The skeptics were wrong, Part 1: Campus free speech was in trouble in 2018, and the data shows it has gotten much worse. Available online: https://greglukianoff.substack.com/p/the-skeptics-were-wrong-part-1; Lukianoff, G. & Stevens, S (March 21, 2024). The skeptics were wrong, part 2: When it comes to free speech, the college kids are not alright. Available online: https://greglukianoff.substack.com/p/the-skeptics-were-wrong-part-2;
[35] Lukianoff, G. & Stevens, S. (May 1, 2024. The skeptics were wrong, Part 3: Surveys on student attitudes toward free speech show alarming trends. Available online: https://greglukianoff.substack.com/p/the-skeptics-were-wrong-part-3.
[36] Custer, S. & Lederman, D. (May 6, 2024). A Weekend of Arrests and Commencement Disruptions: Officers break up encampments at USC and Virginia; Vermont and Dickinson cancel speakers. Available online: https://www.insidehighered.com/news/students/free-speech/2024/05/06/weekend-arrests-and-commencement-disruptions-over-israel-gaza; New York Times. (May 12, 2024). At Commencements, Protesters Deliver Messages in Many Ways. Available online: https://www.nytimes.com/live/2024/05/12/us/college-campus-protests.
[37] Casey, M. & Shipkowski, B. (May 10, 2024). Police arrest dozens as they break up pro-Palestinian protests at several US universities. Available online: https://apnews.com/article/mit-arizona-pennsylvania-campus-protests-encampment-police-7d9cd0a1f4ac7eaca41b38de798a2217;
Fan, C., Kramer, M., & Duddridge, N. (May 2, 2024). Columbia, City College protests lead to nearly 300 arrests. NYC mayor blames "movement to radicalize young people." Available online: https://www.cbsnews.com/newyork/news/columbia-university-protests-nypd-arrests/;
Lukianoff, G. (May 7, 2024). Campus Chaos: Navigating free speech, unrest, and the need for reform in higher education. Available online: https://greglukianoff.substack.com/p/campus-chaos-navigating-free-speech;
The New York Times. (June 17, 2024). Where Protesters on U.S. Campuses Have Been Arrested or Detained. Available online: https://www.nytimes.com/interactive/2024/us/pro-palestinian-college-protests-encampments.html.
[38] Eduardo, A. (April 25, 2024). Texas tramples First Amendment rights with police crackdown of pro-Palestinian protests. More than 50 arrested after state police storm protestors at University of Texas at Austin.. Available online: https://www.thefire.org/news/texas-tramples-first-amendment-rights-police-crackdown-pro-palestinian-protests;
Fisher, L. (May 3, 2024). UT’s War on Students: A peaceful protest spiraled when law enforcement showed up. Now the university has doubled down. Available online: https://www.austinchronicle.com/news/2024-05-03/uts-war-on-students/.
Lane, L. (April 30 2024). Fact check on statements from IU, ISP: Snipers, external participants, free speech. Available online: https://www.heraldtimesonline.com/story/news/education/campus/2024/04/30/answering-questions-about-the-gaza-war-protests-in-ius-dunn-meadow/73503596007/;
Sandweiss, E. (April 29, 2024). State police leader confirms rooftop sniper at IU protest, responds to excessive force accusations. Available online: https://www.wfyi.org/news/articles/state-police-leader-confirms-rooftop-sniper-at-iu-protest-responds-to-excessive-force-accusations;
Washington, J. (March 19, 2024). ‘Winning war on woke higher education,’ Anti-DEI efforts continue, some minority students struggle. Available online: https://www.kxan.com/news/winning-war-on-woke-higher-education-anti-dei-efforts-continue-some-minority-students-struggle/.
[39] The self-censorship component was introduced this year and is a composite score of responses to the three questions that are presented after self-censorship is defined. In previous years other questions were used to measure self-censorship and they were factored into the “Comfort Expressing Ideas” component.
[40] A full list of all the deplatforming incidents that impacted the 2025 College Free Speech Rankings is available here:
The full Campus Deplatforming database is available on FIRE’s website at https://www.thefire.org/research-learn/campus-deplatforming-database.
[41] A full list of all the scholar sanction attempts that impacted the 2025 College Free Speech Rankings is available here: https://www.thefire.org/sites/default/files/2024/08/2025-CFSR-Behavioral-Metrics-FINAL.xlsx. The full Scholars Under Fire database is available on FIRE’s website at https://www.thefire.org/research-learn/scholars-under-fire.
[42] All data reported in this section reflect the Students Under Fire database as of June 15, 2024. A full list of all the student sanction attempts that impacted the 2025 College Free Speech Rankings is available here: https://www.thefire.org/sites/default/files/2024/08/2025-CFSR-Behavioral-Metrics-FINAL.xlsx. The full Students Under Fire database is currently internal to FIRE but will be released in full in early 2025.
[43] Schools were not penalized for how they handled the encampment protests. As this report demonstrates, the impact of the encampment protests on the campus speech climate is captured by responses to survey questions that ask students about their confidence in that their college administration protects speech rights on campus, their comfort expressing controversial political views, and how frequently they self-censor. Deplatformings that occurred during the encampment protests were also still included in the calculation of the 2025 College Free Speech Rankings.
[44] See: Using FIRE’s Spotlight Database. Available online: https://www.thefire.org/research-learn/using-fires-spotlight-database.
[45] The Spotlight Database is available on FIRE’s website: https://www.thefire.org/resources/spotlight/.
[46] All data reported in this section reflect the Campus Deplatforming database as of June 15, 2024. A full list of all the deplatforming incidents that impacted the 2025 College Free Speech Rankings is available here: https://www.thefire.org/sites/default/files/2024/08/2025-CFSR-Behavioral-Metrics-FINAL.xlsx. The full Campus Deplatforming database is available on FIRE’s website at https://www.thefire.org/research-learn/campus-deplatforming-database.
[47] Deplatforming campaigns that targeted multiple forms of expression (e.g., targeting multiple speakers at an event or targeting multiple pieces of artwork for removal) and that impacted the College Free Speech Rankings were counted as a singular incident.
[48] All data reported in this section reflect the Scholars Under Fire database as of June 15, 2024. A full list of all the scholar sanction attempts that impacted the 2025 College Free Speech Rankings is available here: https://www.thefire.org/sites/default/files/2024/08/2025-CFSR-Behavioral-Metrics-FINAL.xlsx. The full Scholars Under Fire database is available on FIRE’s website at https://www.thefire.org/research/scholars-under-fire-database/.
[49] FIRE’s Scholars Under Fire database records all outcomes that occur as a result of a sanction attempt (e.g., investigation, suspension, or termination). FIRE’s College Free Speech Rankings only penalizes schools for the most severe negative outcome (e.g., for a termination but not for placing a professor under investigation and/or suspension).
[50] All data reported in this section reflect the Students Under Fire database as of June 15, 2024. A full list of all the student sanction attempts that impacted the 2025 College Free Speech Rankings is available here: https://www.thefire.org/sites/default/files/2024/08/2025-CFSR-Behavioral-Metrics-FINAL.xlsx. The full Students Under Fire database is currently internal to FIRE but will be released in full in early 2025.