Table of Contents


2024 College Free Speech Rankings


Read the latest College Free Speech Rankings report from FIRE
If America’s colleges could earn report cards for free speech friendliness, most would deserve an “F”— and conservative students are increasingly joining their liberal peers in supporting censorship.
Executive Summary
For the fourth year in a row, the Foundation for Individual Rights and Expression (FIRE), a nonprofit organization committed to defending and sustaining the individual rights of all Americans to free speech and free thought, and College Pulse surveyed college undergraduates about their perceptions and experiences regarding free speech on their campuses.
This year’s survey includes 55,102 student respondents from 254 colleges and universities.[1] Students who were enrolled in four-year degree programs were surveyed via the College Pulse mobile app and web portal from January 13 to June 30, 2023.
The College Free Speech Rankings are available online and are presented in an interactive dashboard (rankings.thefire.org) that allows for easy comparison between institutions.
Key findings:
- Michigan Technological University is the top-ranked school in the 2024 College Free Speech Rankings. Auburn University, the University of New Hampshire, Oregon State University, and Florida State University round out the top five.
- Harvard University obtained the lowest score possible, 0.00, and is the only school with an “Abysmal” speech climate rating. The University of Pennsylvania, the University of South Carolina, Georgetown University, and Fordham University also ranked in the bottom five.
- The key factors differentiating high-performing schools (the top five) from poorly performing ones (the bottom five) are scores on the components of “Tolerance Difference” and “Disruptive Conduct.” Students from schools in the bottom five were more biased toward allowing controversial liberal speakers on campus over conservative ones and were more accepting of students using disruptive and violent forms of protest to stop a campus speech.
- Deplatforming attempts that occurred at schools ranked in the bottom five had an alarming 81% success rate.
- More than half of students (56%) expressed worry about damaging their reputation because of someone misunderstanding what they have said or done, and just over a quarter of students (26%) reported that they feel pressure to avoid discussing controversial topics in their classes. Twenty percent reported that they often self-censor.
- When provided with a definition of self-censorship, at least a quarter of students said they self-censor “fairly often” or “very often” during conversations with other students, with professors, and during classroom discussions, respectively (25%, 27%, and 28%, respectively). A quarter of students also said that they are more likely to self-censor on campus now — at the time they were surveyed — than they were when they first started college.
- Almost half of the students surveyed (49%) said that abortion is a difficult topic to have an open and honest conversation about on campus. A notable portion of students also identified gun control, racial inequality, and transgender rights, respectively, as topics difficult to discuss (43%, 42%, and 42%, respectively).
- Student opposition to allowing controversial conservative speakers on campus ranged from 57% to 72%, depending on the speaker. In contrast, student opposition to controversial liberal speakers ranged from 29% to 43%, depending on the speaker.
- More than 2 in 5 students (45%) said that students blocking other students from attending a speech is acceptable to some degree, up from 37% last year. And more than a quarter of students (27%) said that using violence to stop a campus speech is acceptable to some degree, up from 20% last year.
- More than 1 in 5 students (21%) reported that their college administration’s stance on free speech on campus is not clear, and more than a quarter of students (27%) reported that it is unlikely their college administration would defend a speaker’s right to express his or her views if a controversy occurred on campus.
About Us
About College Pulse
College Pulse is a survey research and analytics company dedicated to understanding the attitudes, preferences, and behaviors of today’s college students. College Pulse delivers custom data-driven marketing and research solutions, utilizing its unique American College Student Panel™ that includes over 750,000 college students and recent alumni from more than 1,500 two- and four-year colleges and universities in all 50 states.
For more information, visit collegepulse.com or @CollegeInsights on Twitter.
About FIRE
The Foundation for Individual Rights and Expression (FIRE) is a nonpartisan, nonprofit organization dedicated to defending and sustaining the individual rights of all Americans to free speech and free thought. These rights include freedom of speech, freedom of association, due process, legal equality, religious liberty, and sanctity of conscience — the most essential qualities of liberty. FIRE also recognizes that colleges and universities play a vital role in preserving free thought within a free society. To this end, we place a special emphasis on defending these rights of students and faculty members on our nation’s campuses.
For more information, visit thefire.org or @thefireorg on Twitter.
Acknowledgments
Our gratitude goes to Sean Stevens for questionnaire design, developing the scoring methodology, data analysis, and authoring this report; and to Komi Frey and Nathan Honeycutt for support with questionnaire design, developing the scoring methodology, data analysis, data validation, and editing. We would additionally like to thank Sam Abrams for help with questionnaire design and developing the scoring methodology; and Logan Dougherty, Angela C. Erickson, and Sigrid Fry-Revere, for support with data validation.
Greg Lukianoff
President and CEO, FIRE
Suggested Citation
Stevens, S.T. (2023). 2024 College Free Speech Rankings: What Is the State of Free Speech on America’s College Campuses? The Foundation for Individual Rights and Expression.
https://www.thefire.org/research-learn/2024-college-free-speech-rankings
Overview
In 2020, FIRE, in collaboration with College Pulse and RealClearEducation, launched a first-of-its-kind tool to help high school students and their parents identify which colleges promote and protect the free exchange of ideas: the College Free Speech Rankings. The response to the rankings report and corresponding online tool was overwhelmingly positive.
We heard from prospective students how helpful it is to see what a large number of current students reported about the campus climate for open discussion and inquiry, allowing for comparisons between colleges. We also heard from colleges and universities that the rankings helped them better understand their campus climate in order to improve it. Similarly, professors and staff became better able to understand which topics students on their campus find difficult to discuss.
Each year, we have increased the number of campuses surveyed — from 55 in 2020 to 254 this year. In these four years, we have obtained survey responses from more than 150,000 undergraduates, including 55,102 this year. As in previous years, the College Free Speech Rankings dashboard (rankings.thefire.org) is available on the College Pulse website and the FIRE website. The dashboard offers a unique tool to compare schools’ free speech rankings and to explore a set of other factors that students find important in a college or university, such as cost and proximity to home.
Current college students, professors, and administrators can use the rankings to better understand their own campus climate and see how it compares to that of others across the country.
The College Free Speech Rankings offers students, parents, professors, administrators, and any other interested constituency unrivaled insight into undergraduate attitudes about and experiences with free expression on their college campuses. It also allows one to compare different colleges’ cultures for free expression. Prospective students and their parents, as well as students considering transferring to another college, can use the rankings to assess and compare the speech climates at the different schools they are considering. Current college students, professors, and administrators can use the rankings to better understand their own campus climate and see how it compares to that of others across the country.
The data described in this report provide a wealth of information about current college students’ attitudes about free speech and its current state on college campuses across America. Do students feel comfortable speaking out about topics they are passionate about, even when they have a minority viewpoint, in the classroom or in common campus areas? Are they open to hearing from different and sometimes controversial speakers? Are they at least open to a campus environment in which speakers are allowed to visit and speak without facing a heckler’s veto — or worse?
The body of this report sheds light on these questions, among others.
It contains three sections. First, it presents the core findings of the 2024 College Free Speech Rankings. Next, it compares the top five and bottom five schools in the rankings in detail. Finally, it presents analyses of the free speech attitudes and experiences of the college students surveyed at the national level.
2024 College Free Speech Rankings
In its first year of inclusion in the College Free Speech Rankings, Michigan Technological University obtained the top spot with an overall score of 78.01. The full list of the top five schools and their scores is as follows:
- Michigan Technological University (78.01)
- Auburn University (72.53)
- University of New Hampshire (72.17)
- Oregon State University (71.56)
- Florida State University (69.64)
Each of the top four schools earned a “Good” speech climate rating, while Florida State earned an “Above Average” rating. Last year’s top-ranked school, the University of Chicago, received a score of 65.95. It received a ranking of 13 and also earned an “Above Average” speech climate rating.
At the other end of the rankings, Harvard University came in dead last with the lowest score possible, 0.00, more than four standard deviations below the mean. The full list of the bottom five schools and their scores is as follows:
- Harvard University (0.00)
- University of Pennsylvania (11.13)
- University of South Carolina (12.24)
- Georgetown University (17.45)
- Fordham University (21.72)
Fordham earned a “Poor” speech climate rating; Georgetown, University of Pennsylvania, and University of South Carolina each earned a “Very Poor” rating; and Harvard earned an “Abysmal” rating.
Further, Harvard’s overall score of 0.00 is generous — its actual score is -10.69, more than six standard deviations below the average and more than two standard deviations below the second-to-last school in the rankings and its Ivy League counterpart, the University of Pennsylvania. Last year’s lowest ranked school, Columbia University, also a member of the Ivy League, this year earned a score of 34.60, a ranking of 214, and a “Below Average” speech climate rating.
While alarming, Harvard’s dismal performance this year is not an aberration.
The rankings, overall score, and speech climate for the top 25 colleges are presented below. Scores are standardized and can range from 0 to 100. The top 25 include 20 schools that received FIRE’s “green light” rating (including the top 16) and five that received FIRE’s “yellow light” rating for their speech-related policies. The Illinois Institute of Technology (55.77) was the highest ranked “red light” school at 42.
The full rankings for all 248 schools and the methodology are available in the Appendix as well as on the College Free Speech Rankings dashboard on the College Pulse website and on the FIRE website.[2]
Table 1: Top 25 Colleges for Freedom of Speech
| Rank | School | Overall Score | Speech Climate |
|---|---|---|---|
| 1 | Michigan Technological University | 78.01 | Good |
| 2 | Auburn University | 72.53 | Good |
| 3 | University of New Hampshire | 72.17 | Good |
| 4 | Oregon State University | 71.56 | Good |
| 5 | Florida State University | 69.64 | Above Average |
| 6 | University of Virginia | 68 | Above Average |
| 7 | Texas A&M University | 67.92 | Above Average |
| 8 | George Mason University | 67.65 | Above Average |
| 9 | University of North Carolina, Greensboro | 67.53 | Above Average |
| 10 | University of Colorado, Boulder | 66.54 | Above Average |
| 11 | North Carolina State University | 66.19 | Above Average |
| 12 | University of South Florida | 66.08 | Above Average |
| 13 | University of Chicago | 65.95 | Above Average |
| 14 | Mississippi State University | 65.61 | Above Average |
| 15 | Eastern Kentucky University | 65.51 | Above Average |
| 16 | Northern Arizona University | 65.34 | Above Average |
| 17 | University of Missouri, St. Louis | 64.88 | Above Average |
| 18 | Kansas State University | 63.35 | Above Average |
| 19 | University of Maryland | 63 | Above Average |
| 20 | Washington and Lee University | 62.99 | Above Average |
| 21 | University of North Carolina, Charlotte | 62.54 | Above Average |
| 22 | University at Buffalo | 62.2 | Above Average |
| 23 | Carnegie Mellon University | 61.47 | Above Average |
| 24 | East Carolina University | 59.68 | Slightly Above Average |
| 25 | New Jersey Institute of Technology | 58.87 | Slightly Above Average |
Over the past four years, a handful of schools have consistently performed well in the College Free Speech Rankings. For instance, the University of Chicago claimed the top spot in the rankings twice (2020 and 2023) and earned a ranking of 2 in 2021 and a ranking of 13 this year. Kansas State University twice earned a ranking of 2 (2020 and 2023), earned a ranking of 14 in 2021, and earned a ranking of 18 this year. Indeed, with a few exceptions (this year, Purdue; last year, Texas A&M and the University of Colorado, Boulder) every school listed in the table below finished in the top 25 of the College Free Speech Rankings every year that it was included, and those that did not did not finish in the top 25 did not land far outside of it.
The likelihood that Texas A&M will appear on this list next year, however, is slim. This is because of two recent incidents involving scholar sanctions that occurred in July of 2023 after the overall scores for the College Free Speech Rankings were calculated. Texas A&M therefore, was not penalized in this year’s rankings for these sanctions. These penalties will be applied next year.[3]
Table 2: Schools With Consistently High Rankings Over Time
| School | Years Ranked | Highest Ranking | Average Ranking |
|---|---|---|---|
| University of Chicago | 2020, 2021, 2022, 2023 | 1 (2020, 2022) | 4 |
| University of New Hampshire | 2021, 2022, 2023 | 3 (2021, 2023) | 7 |
| Florida State University | 2021, 2022, 2023 | 5 (2021, 2023) | 8 |
| Kansas State University | 2020, 2021, 2022, 2023 | 2 (2020, 2022) | 9 |
| Oregon State University | 2021, 2022, 2023 | 4 (2023) | 9 |
| Mississippi State University | 2021, 2022, 2023 | 4 (2022) | 11 |
| George Mason University | 2021, 2022, 2023 | 8 (2023) | 12 |
| Purdue University | 2021, 2022, 2023 | 3 (2022) | 13 |
| Auburn University | 2021, 2022, 2023 | 2 (2023) | 15 |
| North Carolina State University | 2021, 2022, 2023 | 9 (2022) | 15 |
| University of Virginia | 2020, 2021, 2022, 2023 | 6 (2020, 2023) | 15 |
| Texas A&M University | 2020, 2021, 2022, 2023 | 3 (2020) | 19 |
| University of Colorado, Boulder | 2020, 2021, 2022, 2023 | 10 (2023) | 19 |
Identifying schools that consistently perform poorly is trickier because the number of schools surveyed has increased each year. Thus, a school dropping in the rankings could result from the first-time inclusion in the rankings of schools with better speech climates and does not necessarily indicate that the speech climate at a previously surveyed school has gotten worse.
One way to account for this is to look at a school’s percentile rank. Based on this factor, the schools that consistently perform poorly include Boston College, Fordham University, Georgetown University, Grinnell College, Harvard University, Marquette University, Middlebury College, Rensselaer Polytechnic Institute, and the University of Texas, Austin.
With two exceptions — Boston College in 2022 and the University of Texas, Austin, in 2021 — these schools consistently finish in the bottom quartile of the rankings, below at least 75% of the schools surveyed in a given year. Thus, while alarming, Harvard’s dismal performance this year is not an aberration.
Warning Colleges
Hillsdale College, with an overall score of 46.87, outperformed all of the other “Warning” schools by at least 10 points. Overall scores at the five other “Warning” schools range from 18.74 (Saint Louis University) to 35.62 (Liberty University). The table below presents their overall scores.
Table 3: “Warning” Colleges
| School | Overall Score | Speech Climate |
|---|---|---|
| Baylor University | 23.8 | Warning |
| Brigham Young University | 25.8 | Warning |
| Hillsdale College | 46.87 | Warning |
| Liberty University | 35.62 | Warning |
| Pepperdine University | 29.17 | Warning |
| Saint Louis University | 18.74 | Warning |
The Best and Worst Colleges for Free Speech in 2024
The average overall score of the top five schools is 72.78. The average overall score of the bottom five schools, in contrast, is 12.51. Both of these averages are lower than those of last year, when the average for the top five was 75.80 and the average for the bottom five was 16.96.
The top five schools this year all received “green light” speech code ratings. In contrast, the bottom five schools either received a “yellow light” rating (Harvard, the University of South Carolina, and the University of Pennsylvania) or a “red light” rating (Georgetown and Fordham).
Students at schools ranked in the top five and students at schools ranked in the bottom five expressed more tolerance of controversial liberal speakers than of controversial conservative ones.
The rest of this section groups together the top five schools and compares them to the bottom five schools.
Table 4: Best and Worst Colleges for Free Speech
| Best Colleges for Free Speech | Speech Climate | Worst Colleges for Free Speech | Speech Climate |
|---|---|---|---|
| Michigan Technological University | Good | Harvard University | Abysmal |
| Auburn University | Good | University of South Carolina | Very Poor |
| University of New Hampshire | Good | University of Pennsylvania | Very Poor |
| Oregon State University | Good | Georgetown University | Very Poor |
| Florida State University | Above Average | Fordham University | Poor |
Comfort Expressing Ideas
When it comes to students’ comfort expressing their views, the differences between schools in the top five and schools in the bottom five are mostly negligible. The two exceptions are the percentage of students who reported feeling comfortable expressing their views on a controversial political topic in class (43% at the bottom five schools; 39% at the top five schools) and the percentage of students who reported feeling comfortable doing so in a common campus space (50% at the bottom five schools; 44% at the top five schools).
Differences in self-censorship between students at the top five schools and those at the bottom five schools are similarly negligible. Eighteen percent of students at the top five schools reported self-censoring often, compared to 20% at schools in the bottom five. Students at the top five schools were also slightly less worried about damaging their reputation because of someone misunderstanding what they have done or said than those at the bottom five schools: Fifty-four percent of students at the top five schools reported worrying about this, whereas 57% of students at the bottom five schools reported the same. Finally, 25% of students at schools in the top five said they feel a “good deal” or a “great deal” of pressure to avoid discussing controversial topics in their classes, while 27% of students at schools in the bottom five said the same.
The average score on “Comfort Expressing Ideas” at the top five schools (19.82) did not differ significantly from that of the bottom five schools (19.89).[4] Broadly speaking, the average ranking for schools in the top five on “Comfort Expressing Ideas” is 127, with the University of New Hampshire ranking the highest (80) and Auburn University ranking the lowest (159). In contrast, the average ranking for schools in the bottom five on “Comfort Expressing Ideas” is 121. On this measure, Fordham ranks highest (33), while Harvard ranks lowest (193).
Tolerance of Controversial Speakers
Students at schools ranked in the top five and students at schools ranked in the bottom five expressed more tolerance of controversial liberal speakers than of controversial conservative ones. These groups also did not significantly differ on “Mean Tolerance,” meaning students at the top five schools and students at the bottom five schools reported a similar average tolerance for all six controversial speakers.[5]
A majority of students at the top five schools supported allowing four of the six controversial speakers on campus, including all three controversial liberal speakers. Students at the bottom five schools supported allowing all three controversial liberal speakers on campus but opposed allowing all three controversial conservative speakers. On this component, the top five schools and the bottom five schools, again, received similar average rankings (98 and 95, respectively).[6]
The percentage of students at schools ranked in the top five who said it is never acceptable for students to shout down speakers, block entry to a campus speech, or use violence to stop a campus speech is at least eight percentage points greater than that of students at schools ranked in the bottom five.
Nevertheless, a bias toward allowing controversial liberal speakers on campus and not allowing conservative ones is evident at the bottom five schools. Schools ranked in the bottom five have a significantly higher tolerance difference than schools ranked in the top five (2.41 and 1.32, respectively). Furthermore, this favoritism toward allowing controversial liberal speakers on campus among students at schools in the bottom five is not due to their counterparts at schools in the top five being significantly more tolerant of controversial conservative speakers. Students at the top five schools and students at the bottom five schools also have similar levels of tolerance toward controversial liberal speakers (6.80 and 6.30, respectively).[7]
Disruptive Conduct
The percentage of students at schools ranked in the top five who said it is never acceptable for students to shout down speakers, block entry to a campus speech, or use violence to stop a campus speech is at least eight percentage points greater than that of students at schools ranked in the bottom five. And average scores on the “Disruptive Conduct” component differed significantly between students at the top five schools (10.39) and those at the bottom five schools (9.54).[8] Broadly speaking, the average “Disruptive Conduct” ranking for top five schools is 41, whereas the average ranking for bottom five schools is 195.
Table 5: Which Disruptive Conduct to Stop a Campus Speech Is “Never Acceptable”
| Ranking | Shouting down a speaker | Blocking other students from attending | Using violence |
|---|---|---|---|
| Top-Five Schools | 45% | 54% | 79% |
| Bottom-Five Schools | 27% | 46% | 68% |
Administrative Support
More than 8 in 10 students (83%) at schools ranked in the top five overall reported that it is at least “somewhat” clear that their administration protects free speech on campus, while almost three-quarters (73%) said it is at least “somewhat” likely their administration would defend a speaker’s rights during a controversy on campus. At schools ranked in the bottom five overall, 76% of students reported it is clear the administration would defend free speech on campus, while 71% reported that their administration would defend a speaker’s rights during a controversy. Schools in the top five and the bottom five did not differ significantly on their “Administrative Support” scores (6.18 and 6.06, respectively).[9] Broadly speaking, schools in the top five have an average ranking of 125 on this component, ranging from 56 (Florida State) to 186 Michigan Technological University. Schools in the bottom five have an average ranking of 157, ranging from 43 (Georgetown) to 235 (University of Pennsylvania).
Openness
Schools in the top five did not differ significantly from schools in the bottom five on their “Openness” score (14.23 and 14.38, respectively).[10] The average ranking for both groups on this component is middling. The average ranking of the top five schools is 143, ranging from 82 (University of New Hampshire) to 180 (Michigan Technological University). The average ranking of the bottom five schools is 127, ranging from 18 (Fordham University) to 216 (University of South Carolina).
The topics of “abortion,” “gender inequality,” “gun control,” “police misconduct,” “racial inequality,” “religion,” “sexual assault,” and “transgender rights” were all identified by at least one-third of students at schools in the top five and at least one-third of students at schools in the bottom five as difficult to have an open and honest conversation about on campus.

College Free Speech Rankings
The College Free Speech Rankings is a comprehensive comparison of the student experience of free speech on their campuses.
The topics of “affirmative action” and “the Israeli-Palestinian conflict” were more often identified as difficult to discuss by students at the bottom five schools than by students at the top five schools:
- Affirmative action (31% of students at the bottom five schools vs. 18% of students at the top five schools)
- The Israeli-Palestinian conflict (33% of students at the bottom five schools vs. 18% of students at the top five schools)
On the other hand, the topics of “gay rights,” “gun control,” and “transgender rights” were more often identified as difficult to discuss by students at the top five schools than by students at the bottom five schools:
- Gay rights (39% of students at the top five schools vs. 30% of students at the bottom five schools)
- Gun control (45% of students at the top five schools vs. 38% of students at the bottom five schools)
- Transgender rights (46% of students at the top five schools vs. 39% of students at the bottom five schools)
Table 6: Topics Difficult to Discuss on Campus
| Topic | Top Five Schools | Bottom Five Schools | Difference (Top Minus Bottom) |
|---|---|---|---|
| Abortion | 54% | 49% | 5% |
| Affirmative action | 18% | 31% | -13% |
| China | 13% | 15% | -2% |
| Climate change | 21% | 15% | 6% |
| Crime | 15% | 18% | -3% |
| Economic inequality | 20% | 25% | -5% |
| Freedom of speech | 23% | 23% | 0% |
| Gay rights | 39% | 30% | 9% |
| Gender inequality | 38% | 34% | 4% |
| Gun control | 45% | 38% | 7% |
| Immigration | 28% | 28% | 0% |
| Inflation | 13% | 11% | 2% |
| The Israeli/Palestinian conflict | 18% | 33% | -15% |
| Police misconduct | 35% | 36% | -1% |
| Racial inequality | 44% | 42% | 2% |
| Religion | 37% | 34% | 3% |
| Sexual assault | 34% | 35% | -1% |
| The Supreme Court | 18% | 17% | -1% |
| Transgender rights | 46% | 39% | 7% |
| War in Ukraine | 13% | 12% | 1% |
| None of the above | 19% | 15% | 4% |
Deplatforming Attempts
Calls to sanction students, student groups, and faculty, and campaigns to get colleges to disinvite speakers from speaking on campus all constitute attempts to deplatform someone, infringing on their right to free expression. Over the past few years, FIRE has documented a surge in attempts to sanction scholars on campuses across the country: Almost half of the entries in our Scholars Under Fire database (47%) have occurred since 2020.[11]
The rate of campus disinvitations is higher now than it was in 2020 or 2021, when many students were not physically on campus due to the COVID-19 pandemic. From 2022-present, 86 disinvitation attempts occurred on campus (52 in 2022; 34 so far this year), whereas 61 disinvitation attempts occurred in 2020 and 2021 (25 in 2020; 36 in 2021).[12] The volume of these attempts and how a school handled each controversy factored significantly into a school’s overall score.
Schools in the top five were not devoid of controversy: A total of nine deplatforming attempts occurred across the five campuses. However, in seven of these attempts, the school supported the student, scholar, or speaker facing a deplatforming campaign. For instance, at Michigan Tech, a petition was launched opposing Brandon Tatum’s invitation to campus by Turning Point USA. In response, the student government denied funding for the event in order to “protect our students.” The school administration overruled this decision, specifically citing its obligation to the First Amendment.
Just six of these deplatforming attempts resulted in the school defending the rights of the student, scholar, or speaker under fire.
The two sanctions at schools in the top five involved scholars at Auburn University and Florida State University. At Auburn, Jesse Goldberg’s faculty position was converted to research-only (no teaching) in response to backlash over his social media comments criticizing the police. At Florida State, Meghan Martinez’s “Weaponizing White Womanhood” class was removed from the course catalog because of backlash over a flier advertising the course.
Schools in the bottom five, on the other hand, averaged almost seven deplatforming attempts per school, and only one school experienced fewer than four (Fordham University, three attempts). Across all five campuses, 32 deplatforming attempts occurred, 26 of which resulted in some form of sanction. This represents a startling, and chilling, deplatforming success rate of 81% and includes three schools with a success rate of 100%. Just six of these deplatforming attempts resulted in the school defending the rights of the student, scholar, or speaker under fire.
Table 7: Deplatforming Attempts at the Bottom Five Schools
| School | Deplatforming Attempts | Sanctions | Success Rate |
|---|---|---|---|
| Harvard University | 9 | 7 | 78% |
| University of South Carolina | 4 | 4 | 100% |
| University of Pennsylvania | 6 | 6 | 100% |
| Georgetown University | 10 | 6 | 60% |
| Fordham University | 3 | 3 | 100% |
What Are the Most Important Factors Differentiating the Best and Worst Schools?
The primary differences between the top five schools and the bottom five schools in student attitudes and perceptions are revealed by the “Tolerance Difference” and “Disruptive Conduct” components. These differences are reflected in student survey responses and in the higher number of deplatforming attempts and sanctions at the bottom five schools (32 and 26, respectively) than at the top five schools (9 and 2, respectively).
It is clear that some campuses attract more controversy than others. For instance, from 2019 to mid-2023, 10 attempts to deplatform scholars occurred at Georgetown and nine occurred at Harvard, while nine in total occurred at all of the schools ranked in the top five.
The sheer volume of these campaigns and their high success rate are the primary reasons Harvard finished dead last in this year’s rankings with the lowest score possible.
Seven of the nine deplatforming attempts at Harvard resulted in some form of sanction. Some of these sanctions include Harvard’s revocation of a speaking invitation to feminist philosopher Devin Buckley; its relocation of an event featuring former Harvard President Lawrence S. Bacow and Harvard Graduate School of Education Dean Bridget Terry Long after protestors occupied the stage and refused to leave; and its termination or separation of three scholars, Lorgia García Peña, David Kane, and Kenneth Roth.
It is also clear that some schools possess poor speech climates, as evidenced by their consistently mediocre-to-poor performance in the College Free Speech Rankings. This list includes Harvard, which recorded the worst performance possible this year, continuing its pattern of poor performances in previous years. It also includes Georgetown University and the University of Pennsylvania, both of which finished in the bottom five last year and this year. Finally, it includes Rensselaer Polytechnic Institute, Marquette University, Middlebury College, and Fordham University, all of which are never far from the bottom of the rankings.
On the other hand, a number of schools have fairly good speech climates — even if all of them still have room for improvement. This list includes Auburn University, the University of New Hampshire, and Florida State University, this year’s second-, third-, and fifth-ranked schools, respectively. It also includes the University of Chicago; the University of Virginia; the University of Colorado, Boulder; Kansas State University; and Purdue University.
These schools have not been free from controversy, nor have they always resolved controversies in ways that support freedom of expression. Nevertheless, one of the key differences between these schools and those that consistently perform poorly is how they respond to speech controversies on campus when they do occur: These schools do not tend to give in to deplatforming demands and are more likely to defend the free expression rights of students, scholars, and speakers invited on their campuses.
National Data
Since 2020, more than 150,000 undergraduates have been surveyed for the College Free Speech Rankings. This year’s survey is the largest ever conducted on undergraduate attitudes about and experience with free expression on college campuses, with a sample size of 55,102. The remainder of this report summarizes the survey’s findings at the national level.
Student Political Views
Regarding politics, the students surveyed identified predominantly as liberal, with 48% identifying this way compared to 19% identifying as conservative and 14% identifying as moderate.
Not surprisingly, 232 of the 254 schools surveyed had a predominantly liberal student body, while only 20 schools had a predominantly conservative one. This latter group includes four of the six “Warning” schools surveyed: Baylor University, Brigham Young University, Hillsdale College and Liberty University.
Two of the schools surveyed had an equal number of liberal and conservative students, the University of South Carolina and the University of Toledo.
The average liberal-to-conservative student ratio on the 232 liberal campuses is 5:1, with an extremely unbalanced maximum of 55:1 at Smith College. In contrast, the average conservative-to-liberal student ratio on the 20 conservative campuses is 3:1, with a maximum of 20:1 at Liberty University. With the exception of Hillsdale College (12:1), the conservative campuses have conservative-to-liberal student ratios of less than 2:1.
How Comfortable Are Students Expressing Political Views on Campus?
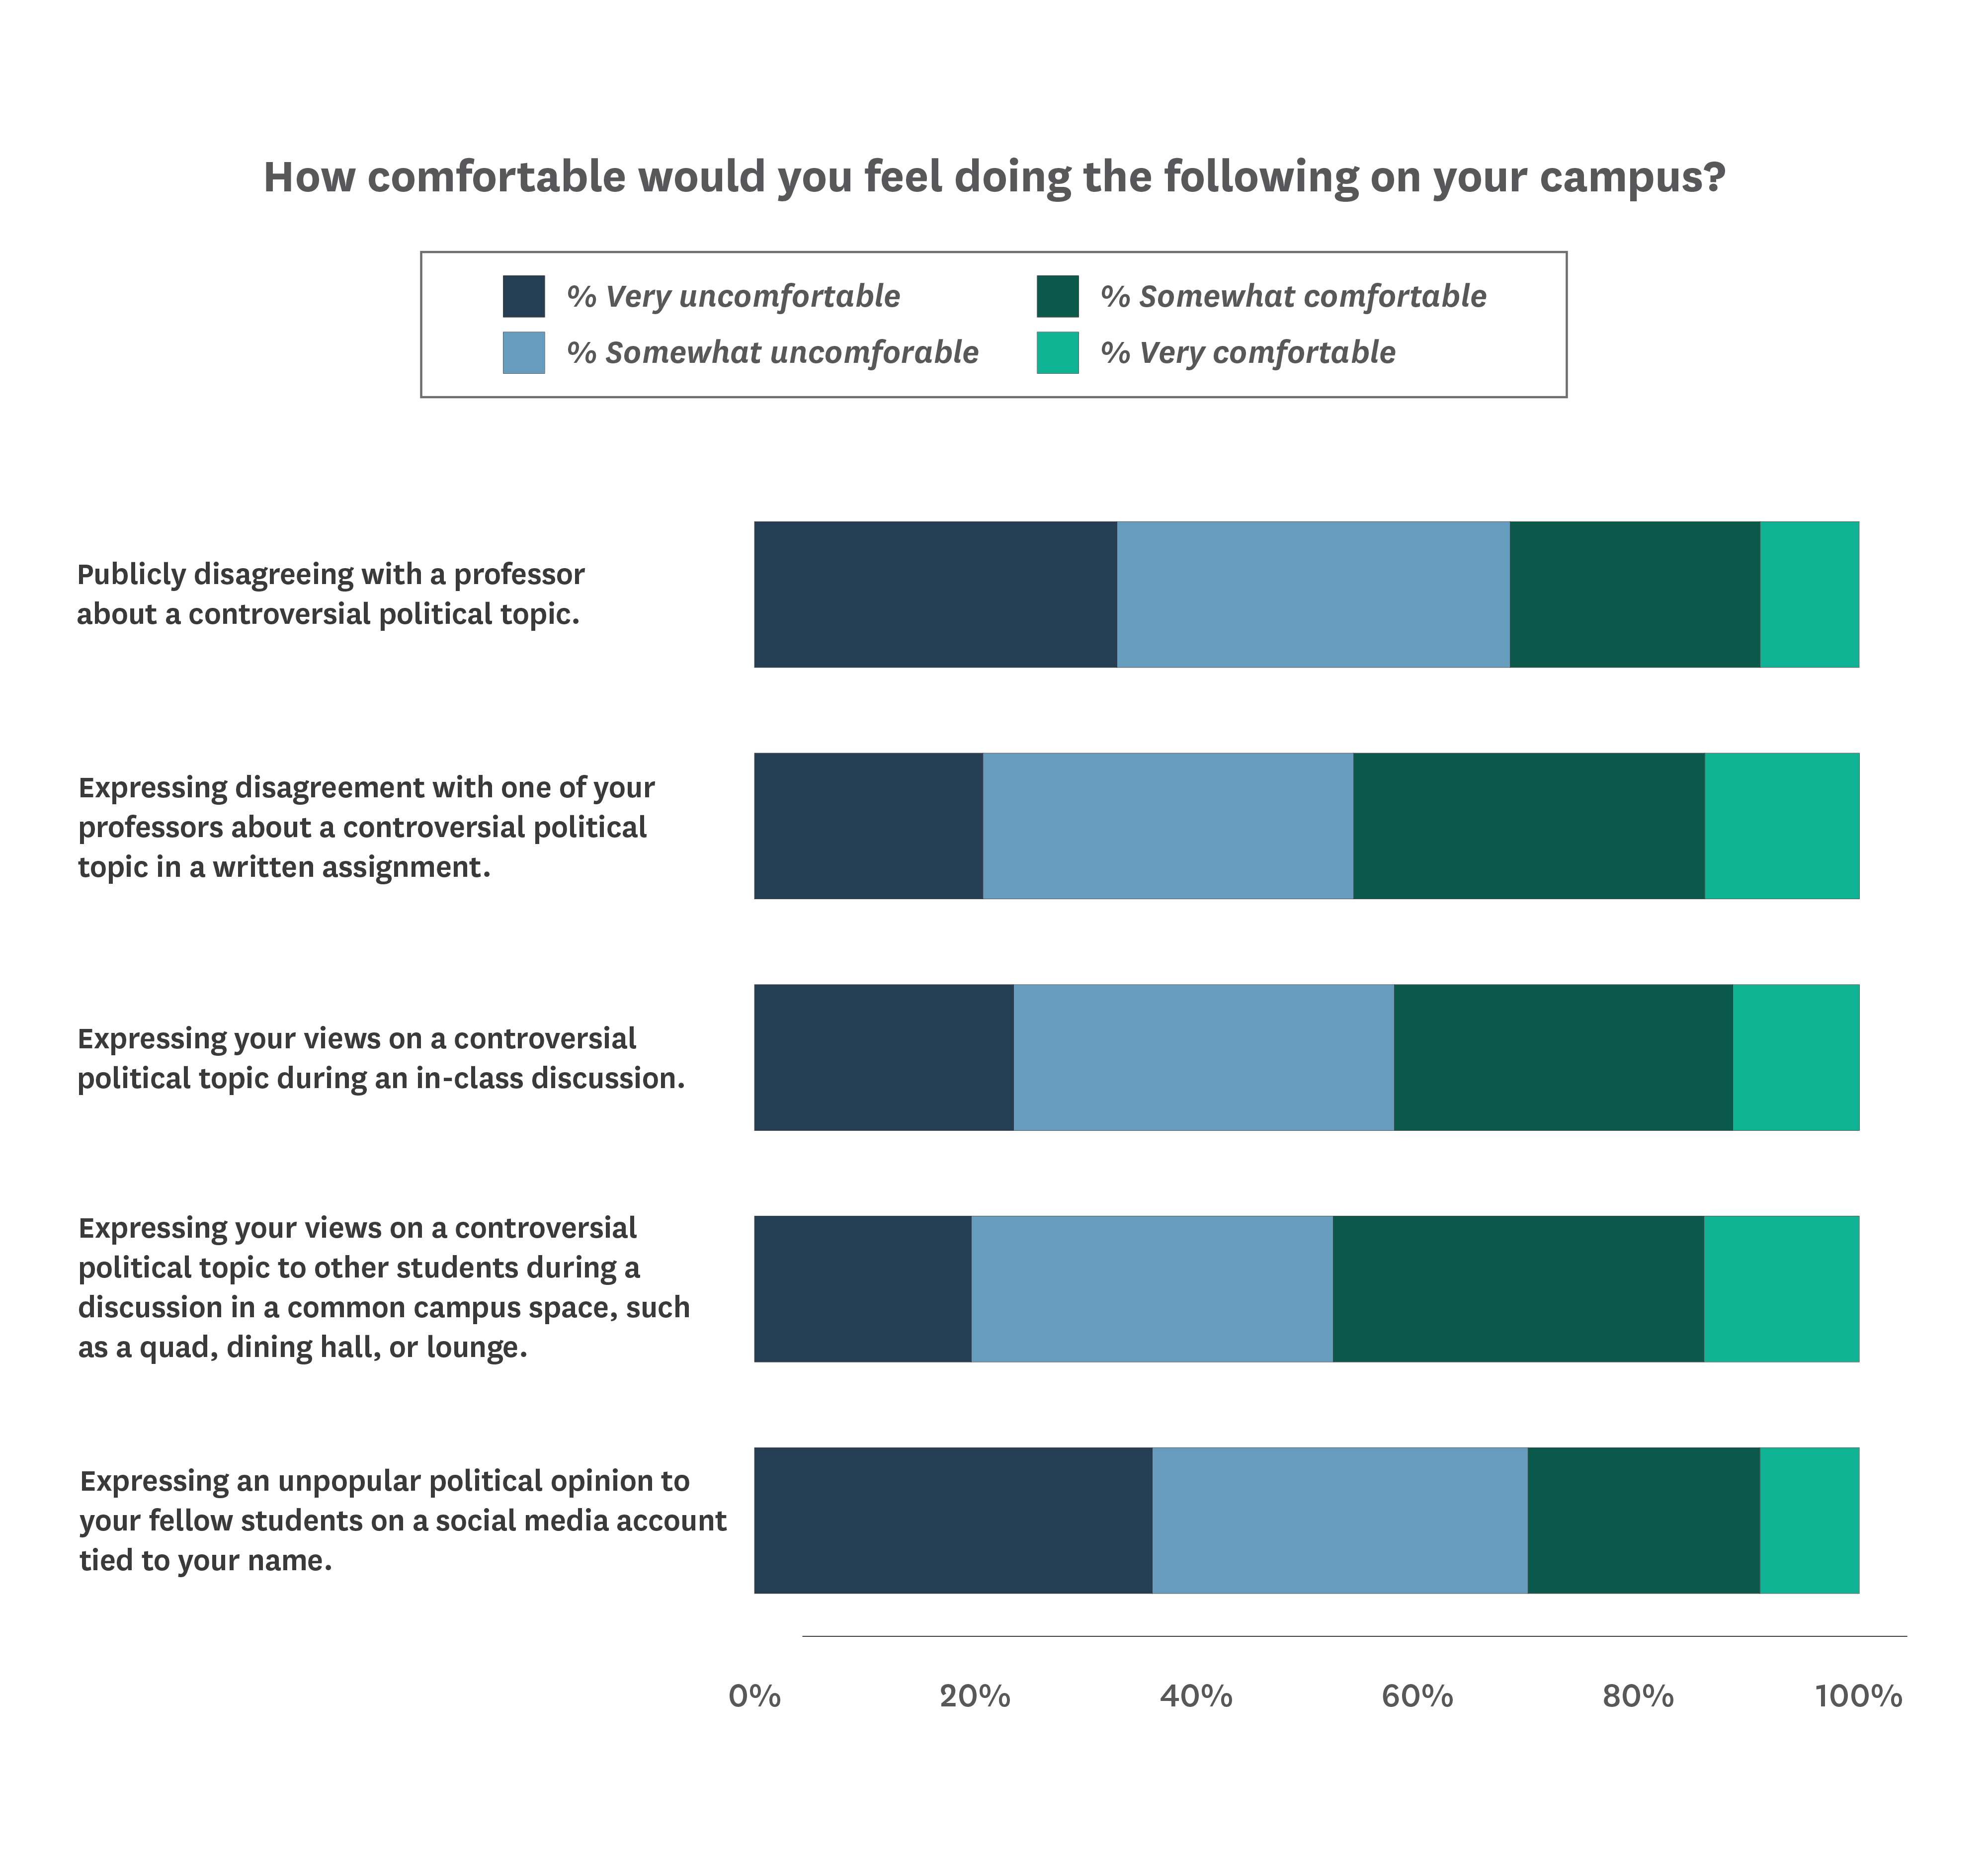
Overall, students reported low levels of comfort expressing their views on controversial political topics across five different contexts on campus.
The percentage of students who reported feeling comfortable ranged from a low of 30%, when expressing an unpopular political opinion to other students on a social media account tied to one’s name, to a high of 48%, when expressing views on a controversial political topic to other students during a discussion in a common campus space.
Students’ responses in some areas differed significantly by race, sex, and political orientation.[13]
Higher percentages of male students than female students, for example, reported feeling comfortable publicly disagreeing with a professor on a controversial political topic (36% of male students; 28% of female students). A higher percentage of male students than female students also reported feeling comfortable disagreeing with their professors on a controversial topic in a written assignment (49% of male students; 43% of female students) and expressing their views on a controversial political topic during in-class discussion (45% of male students; 40% of female students). The percentage of male students and that of female students who reported comfort expressing controversial political views in other contexts, such as in a common campus space or on social media differed only slightly:
- In a common campus space (48% of male students vs. 47% of female students)
- On social media (30% of male students vs. 29% of female students)
A higher percentage of Black students reported feeling comfortable expressing themselves than that of White, Hispanic, or Asian students. For instance, 51% of Black students reported feeling comfortable expressing their views on a controversial political topic during an in-class discussion, while 40% of White students, 42% of Hispanic students, and 37% of Asian students reported the same. This pattern held across all contexts included in the survey. For example, 39% of Black students reported feeling comfortable expressing an unpopular political opinion to one’s peers on a social media account tied to one’s name, whereas 27% of White students, 31% of Hispanic students, and 25% of Asian students reported the same.
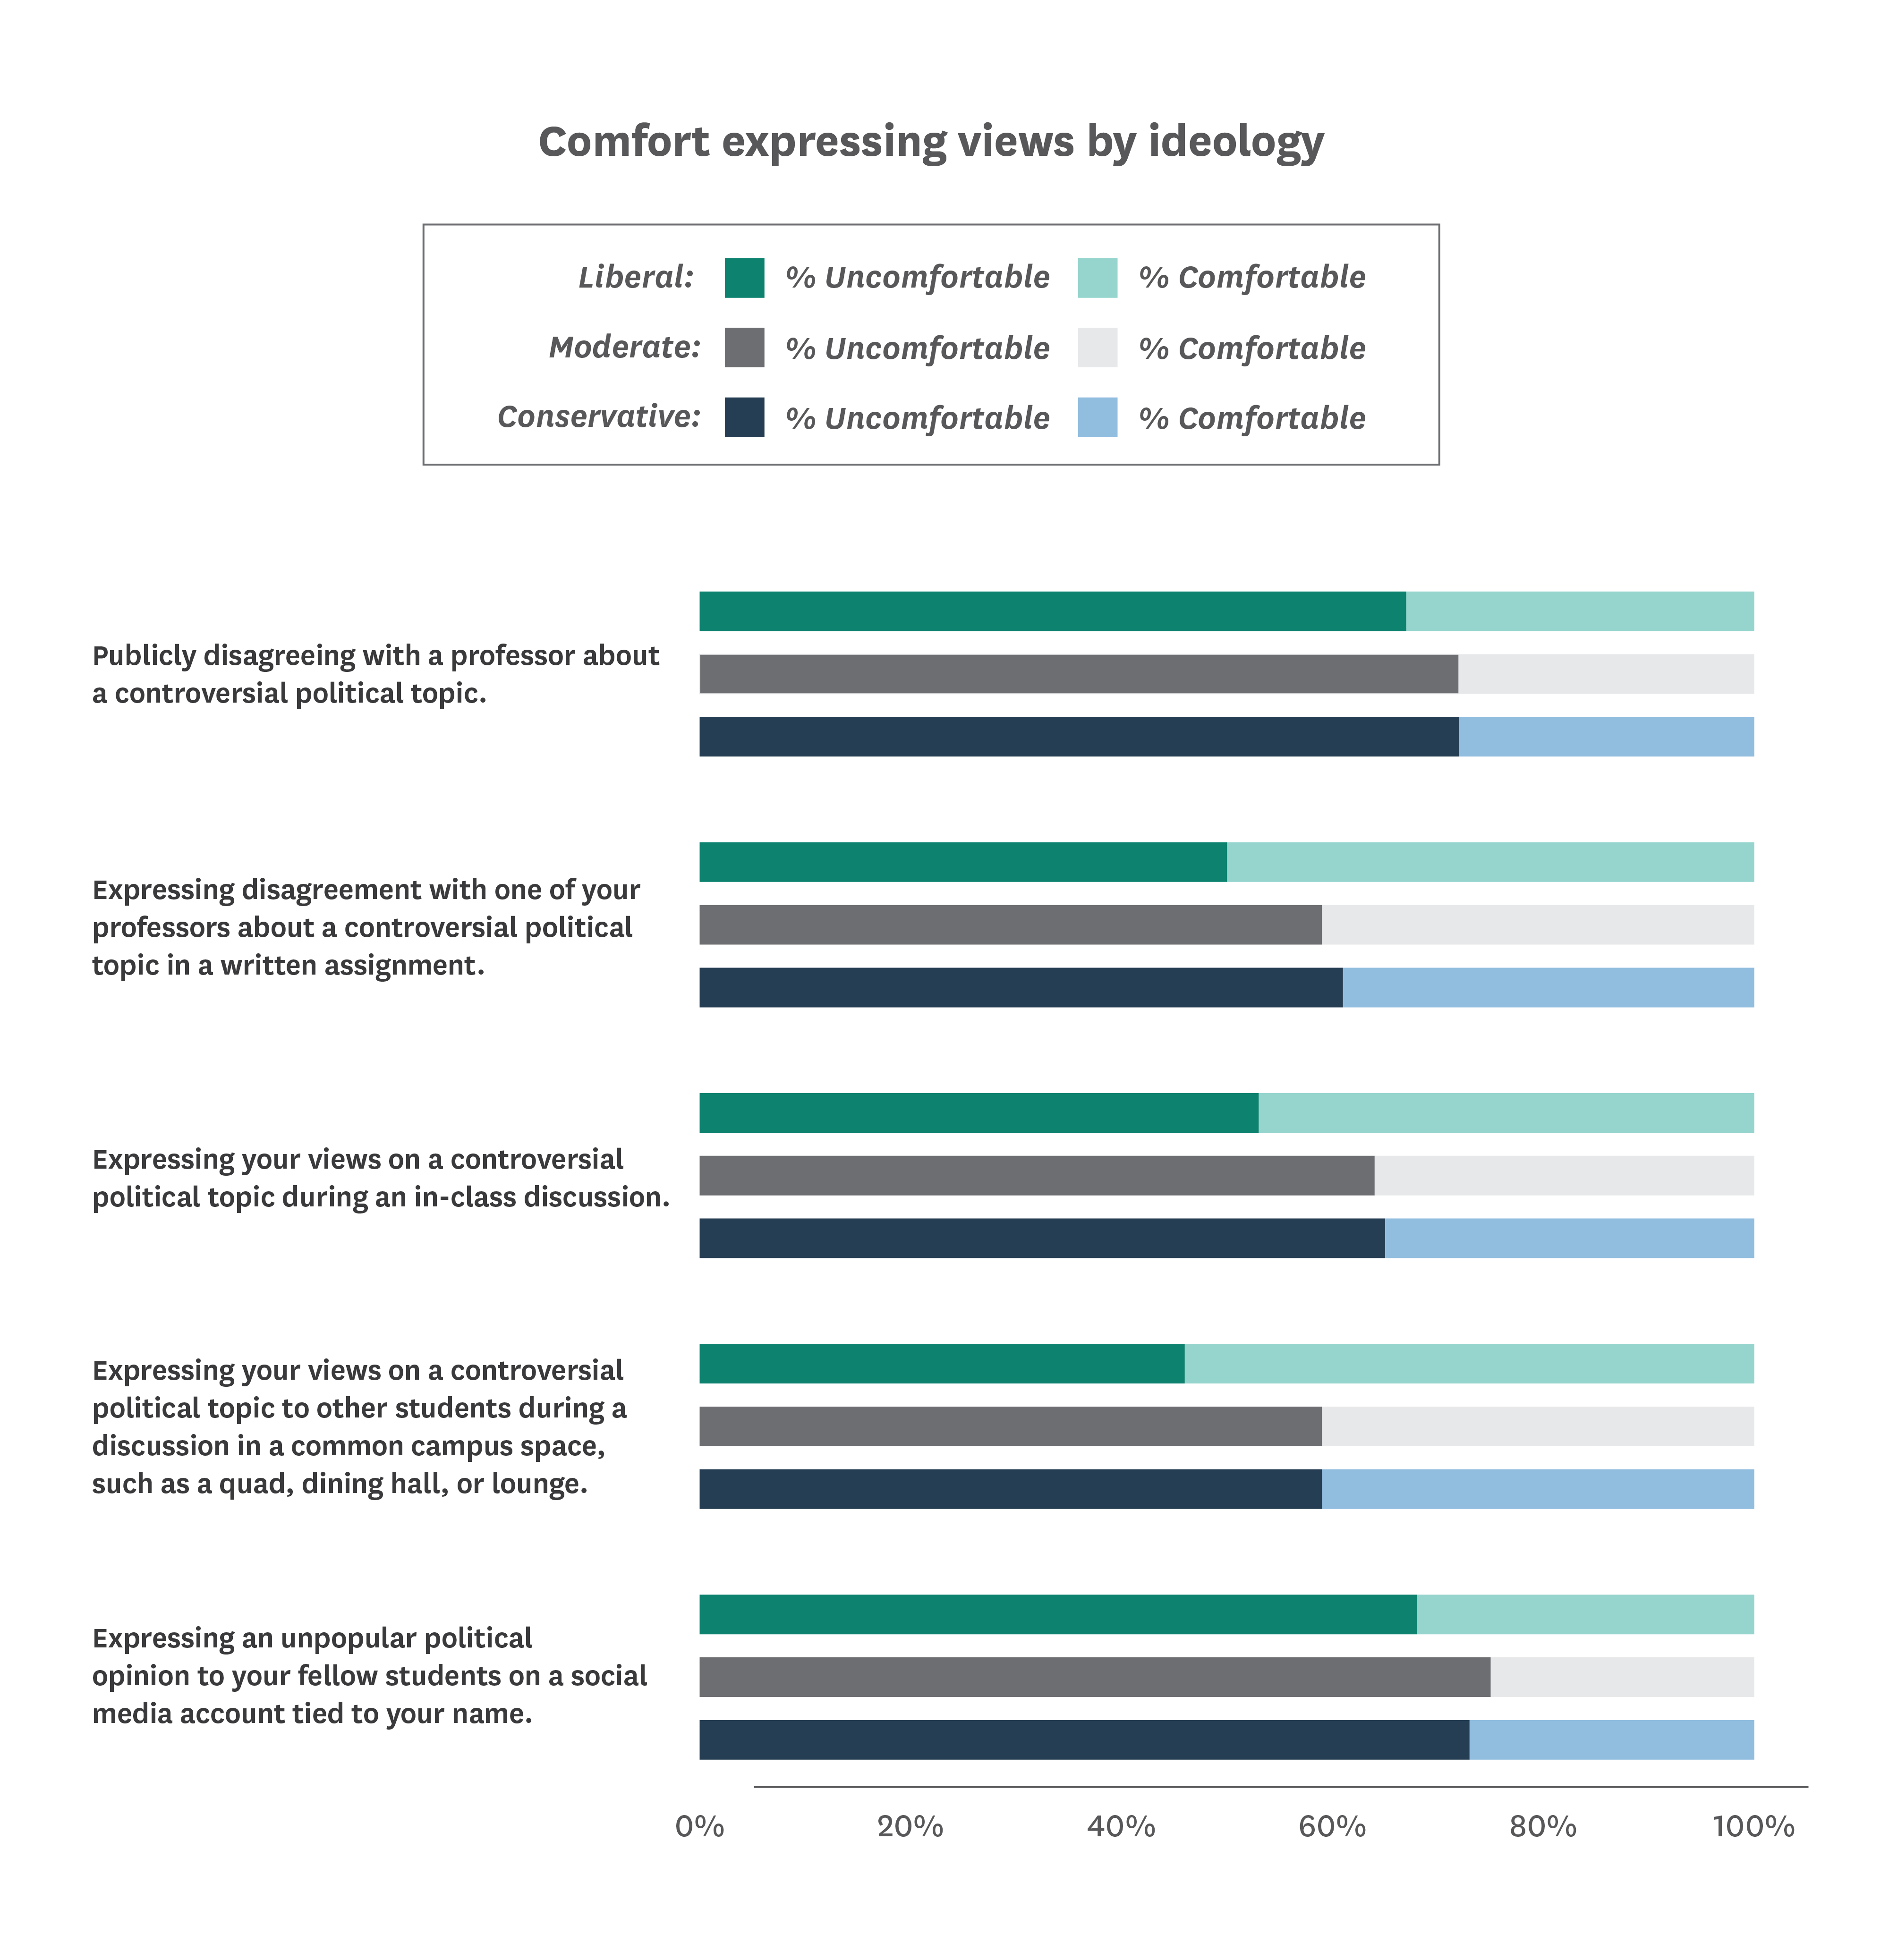
Regarding political identity, Figure 3 demonstrates that liberal students more often reported feeling comfortable expressing themselves across all contexts than did moderate or conservative students. This finding could result from the fact that 48% of college students in the survey self-identified as politically left-of-center, while only 19% of students self-identified as politically right-of-center.
Self-Censorship
Between this year and last year, concern about self-censorship among college students remained largely static. This year, 1 in 5 students (20%) reported that they have either “fairly often” or “very often” felt that they could not express their opinion on a subject because of how students, a professor, or the administration would respond. Last year, this percentage was 22%.
A slightly higher percentage of male students than of female students reported having felt this way often (22% and 18%, respectively). Racial differences were negligible, with a slightly higher percentage of Black students (21%) than of White, Hispanic, or Asian students (19%, 19%, and 17%, respectively) reporting having often felt that they could not express themselves because of how others would respond. Differences between liberal, moderate, and conservative students are starker (14%, 21%, and 33%, respectively).
A considerable percentage of students (56%) expressed worrying “a little” or “a lot” about damaging their reputation because of someone misunderstanding something they have said or done, a decline from last year’s 63%. Roughly the same percentage of males and females reported this level of concern (56% and 55%, respectively). Black students were slightly less likely than White, Hispanic, or Asian students to report worrying about damaging their reputation: 50% of Black students reported worrying about this while 57% of White students, 54% of Hispanic students, and 63% of Asian students reported the same. Ideological differences were also not particularly stark, as 56% of liberals, 57% of moderates, and 59% of conservatives reported worrying about this.
Students were also asked how much pressure they feel to avoid discussing controversial topics in class, and roughly one-quarter of them (26%) reported feeling a “good deal” or a “great deal” of pressure.
Male students were slightly more likely than female students to report feeling a “good deal” or a “great deal” of pressure to avoid discussing controversial topics in class. Racial and ethnic differences also emerged. Asian and Black students were slightly more likely to report feeling a “good deal” or a “great deal” of pressure than were Hispanic students or White students:
- Asian and Black students (27% and 26%, respectively)
- Hispanic and White students (25% and 24%, respectively)
As with the frequency of self-censorship, however, differences between liberal, moderate, and conservative students were starker than differences by sex or race. More than 1 in 3 conservative students (37%) reported feeling pressure to avoid discussing controversial topics, while 30% of moderate students and 19% of liberal students reported the same.
This year we also provided students with a definition of self-censorship and then asked four new questions about their experiences with it on campus.[14] A quarter of students said they self-censor “fairly often” or “very often” during conversations with other students. Twenty-seven percent of students said they self-censor “fairly often” or “very often” during conversations with professors, and 28% said they do so “fairly often” or “very often” during classroom discussions. A quarter of students reported that they are more likely to self-censor on campus now — at the time they were surveyed — than they were when they started college.
Some gender differences emerged. More than a quarter of males (27%) reported self-censoring in conversations with other students often, while 23% of females reported the same. And 29% of males reported that they are more likely to self-censor on campus now — at the time they were surveyed — than they were when they started college, while 23% of females reported the same. Self-censorship during conversations with professors or during in-class discussions did not differ significantly by gender.
In terms of race, Figure 4 shows that Black students were slightly more likely than Hispanic students, Asian students, and White students to say they often self-censor in their conversations with other students, in their conversations with professors, and during in-class discussions.
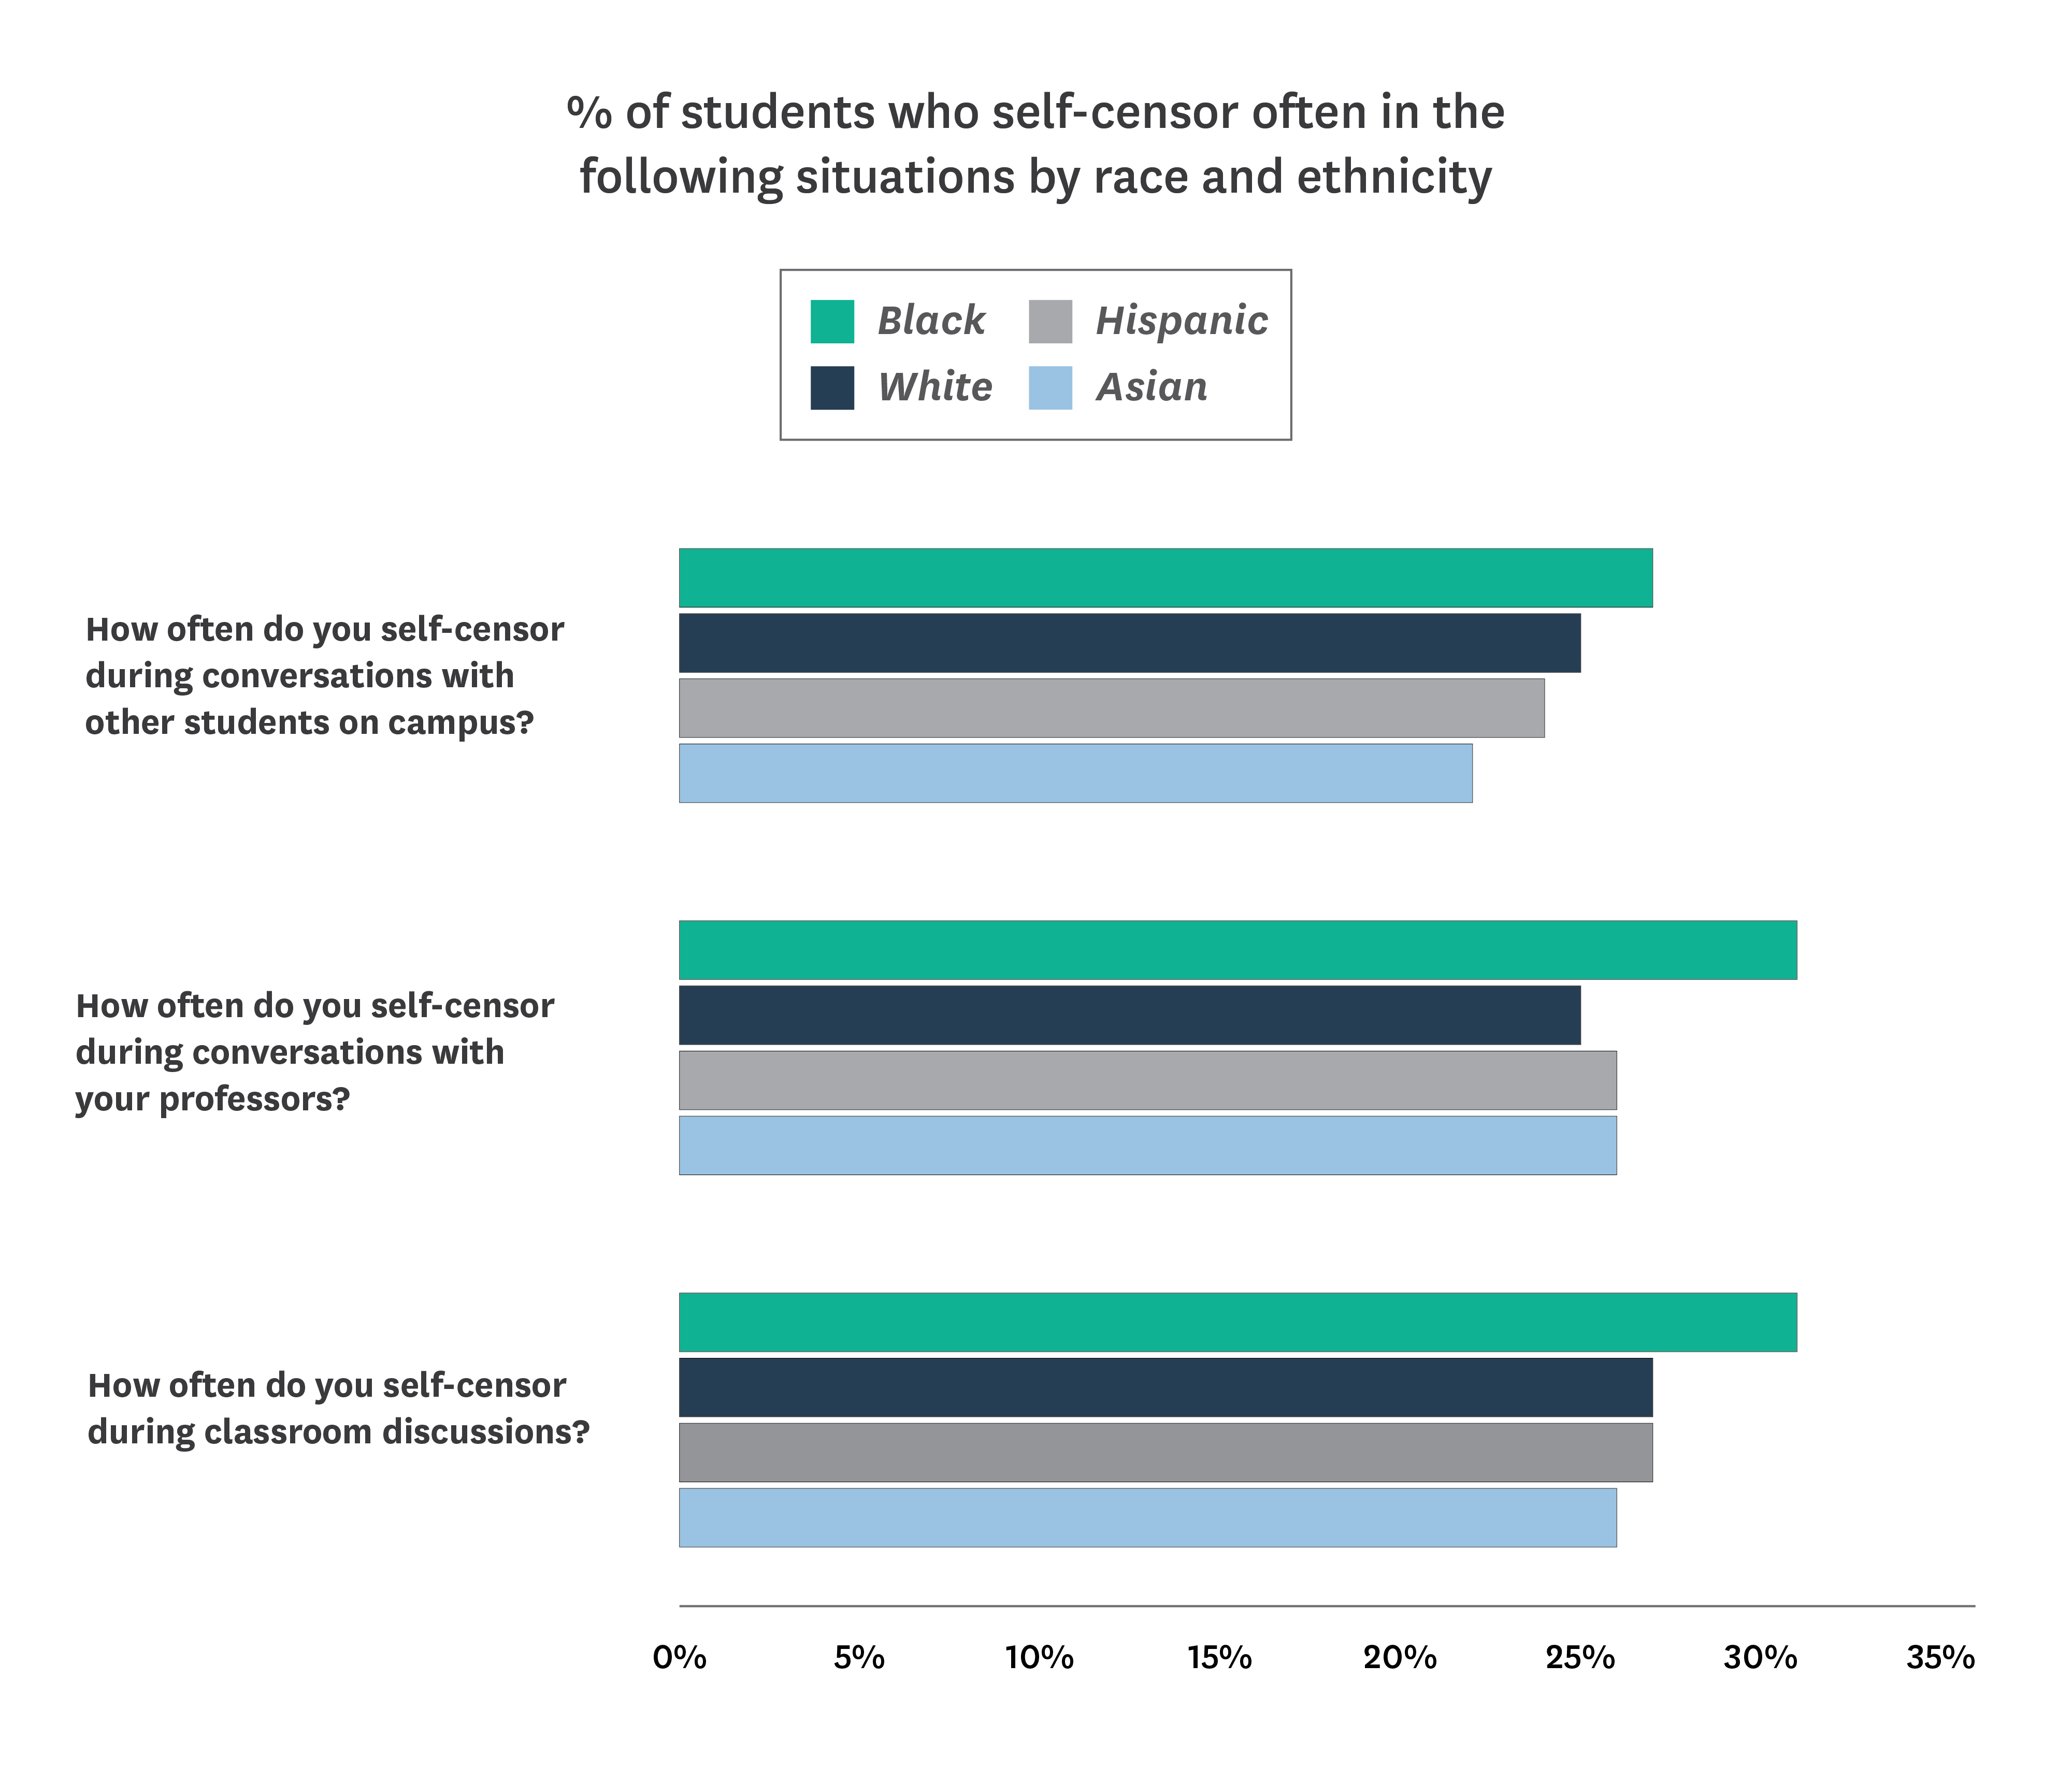
Ideological differences in self-censorship are considerably larger. The percentages of conservatives who report self-censoring in their conversations with other students, in their conversations with professors, and during in-class discussions “fairly often” or “very often” are considerably higher than those of liberal students who self-censor in these contexts at the same rate. They are also higher than the percentages of moderate students who self-censor in these contexts at the same rate:
- In conversations with other students (38% of conservative students; 19% of liberal students; 28% of moderate students)
- In conversations with professors (36% of conservative students; 21% of liberal students; 30% of moderate students)
- During in-in class discussions (40% of conservative students; 21% of liberal students; 31% of moderate students)
More than one-third of conservative students (38%) also reported that they are more likely to self-censor on campus now — at the time they were surveyed — than they were when they started college, while 29% of moderate students and 20% of liberal students reported the same.
The self-censorship questions introduced this year were not included when computing the College Free Speech Rankings.
Which Topics Are Difficult to Discuss?
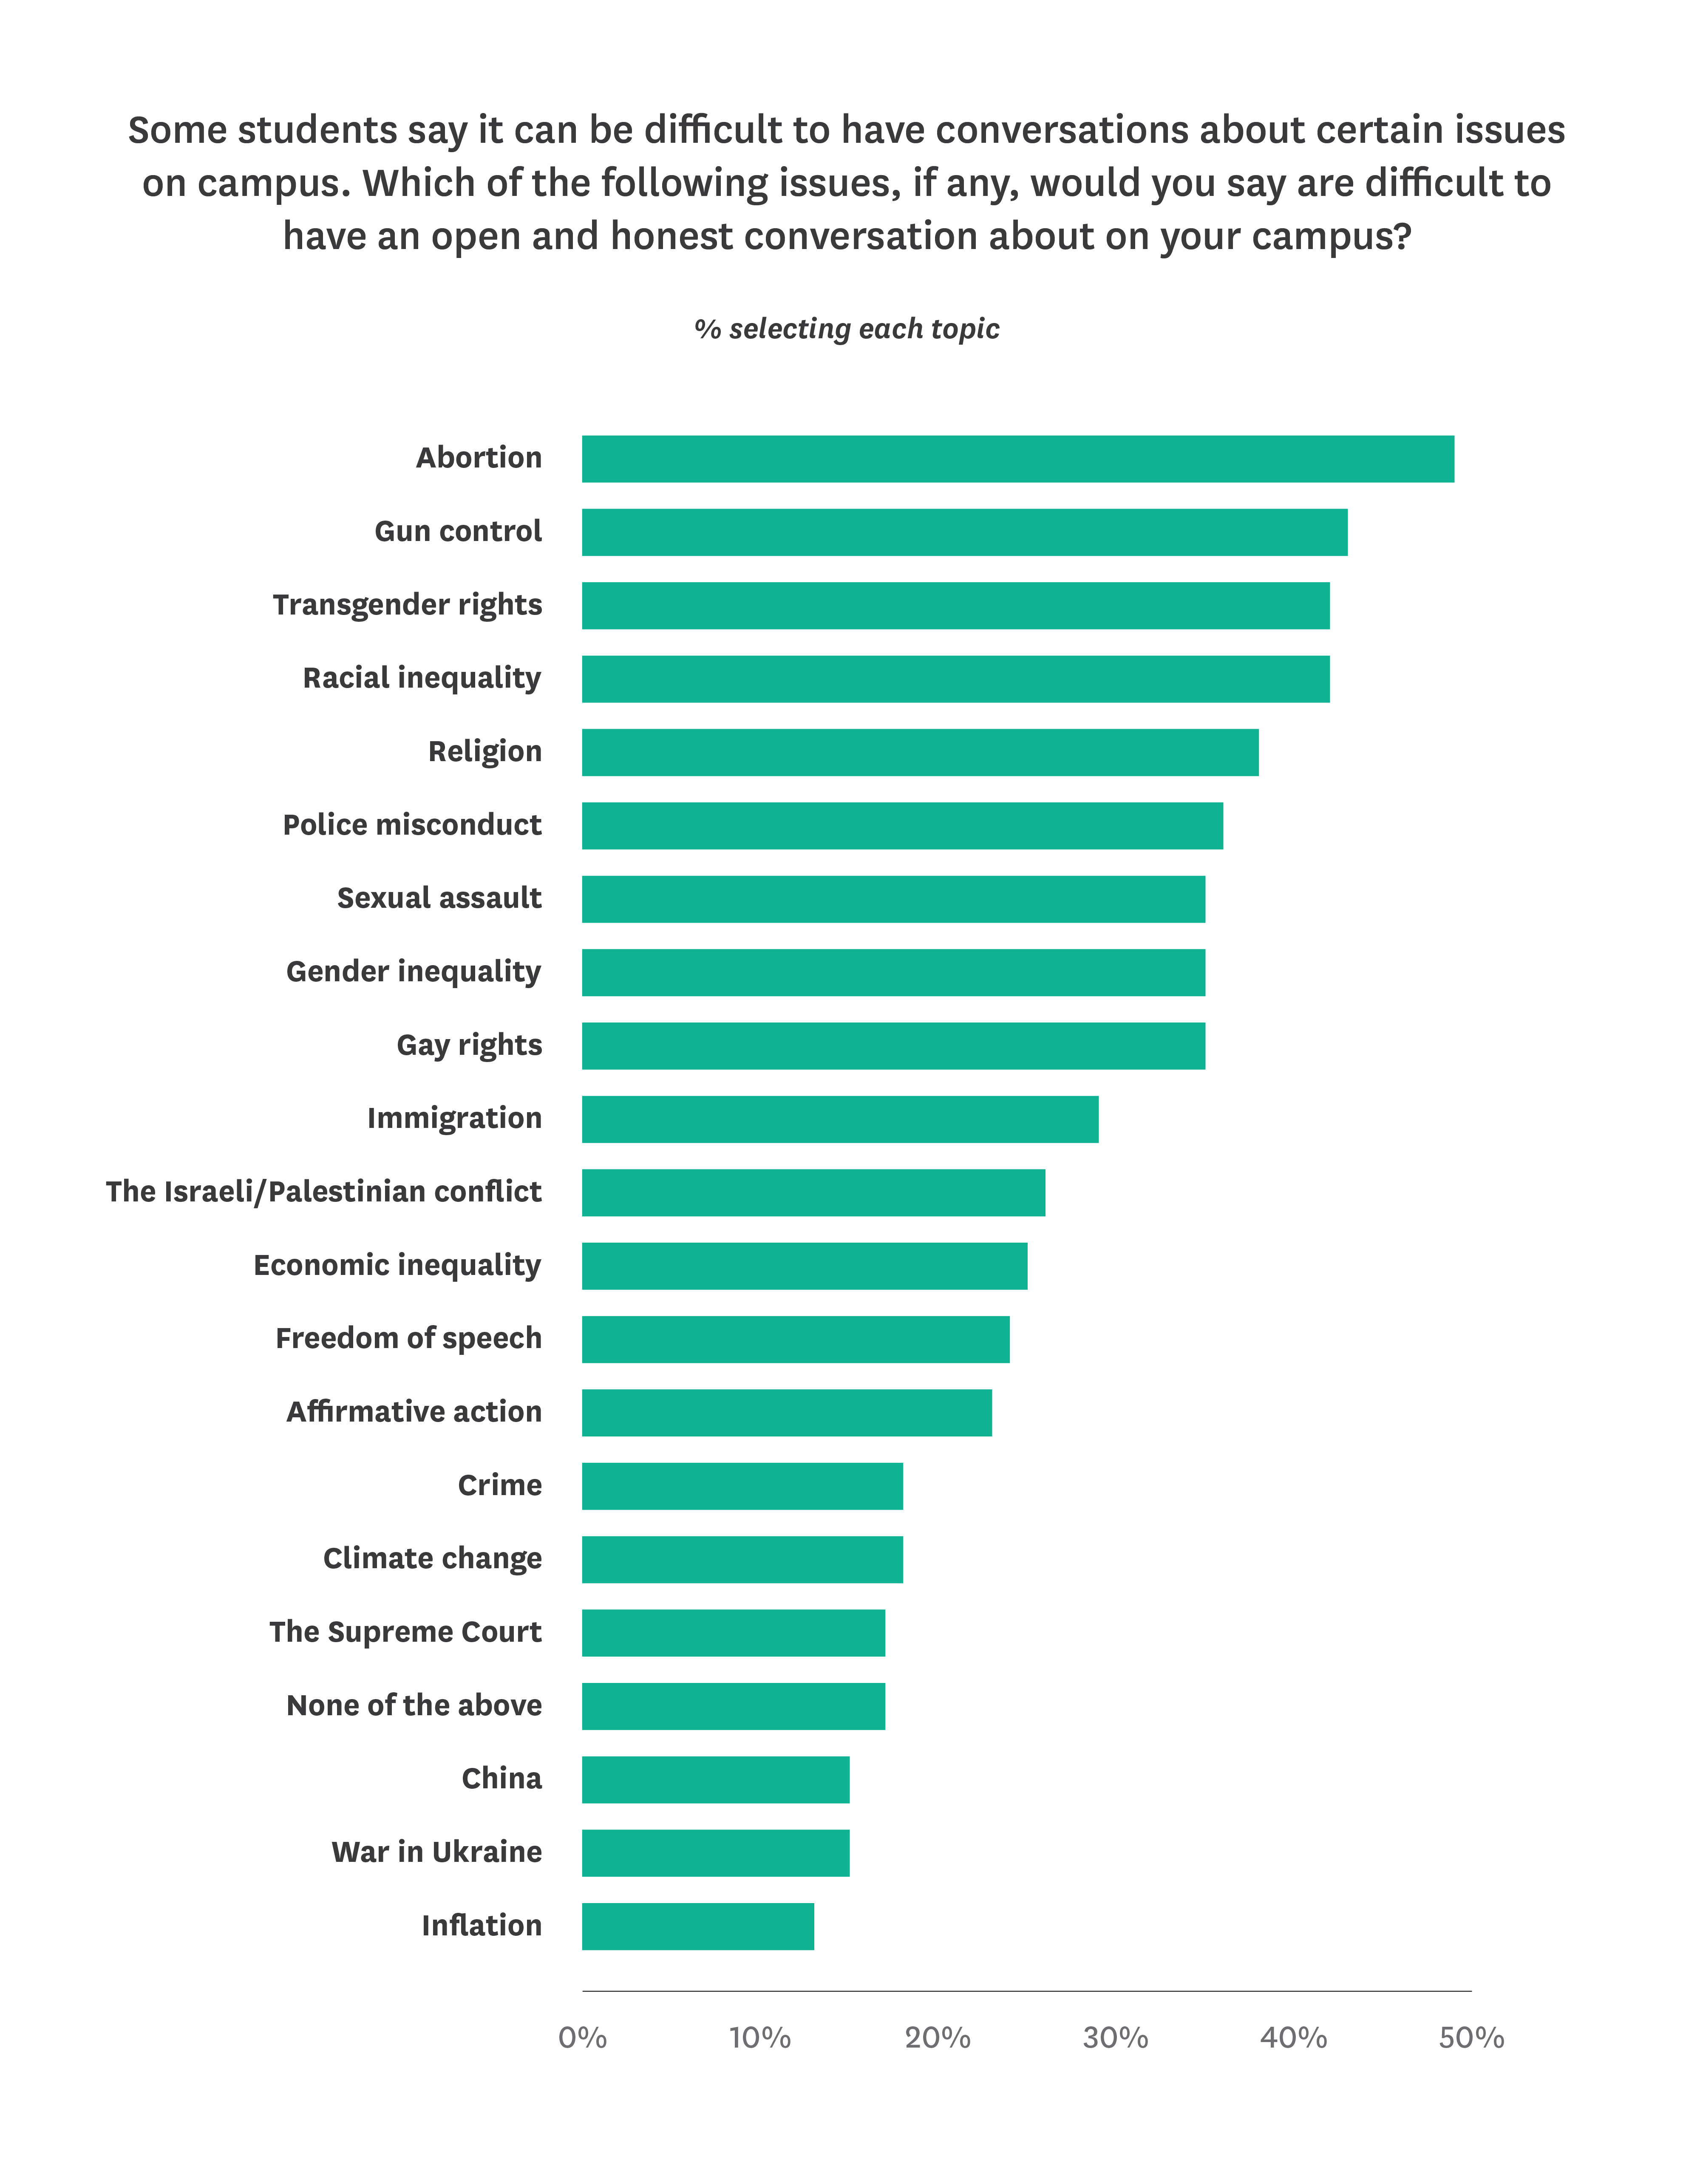
This year’s survey presented students with 20 hot-button political issues and asked them to identify which ones are difficult to have an open and honest conversation about on their campus. The average number of topics students identified as difficult to discuss on campus is 5.77 (S.D. = 5.30).[15]
Of the topics presented, almost half of the students surveyed (49%) identified “abortion” as difficult to discuss. Notable percentages of students also identified “gun control,” “racial inequality,” and “transgender rights” as difficult to discuss (43%, 42%, and 42%, respectively).
Students’ responses differ significantly by sex and race.[16]
Female students were more likely than male students to identify the topics of “abortion,” “sexual assault,” “gun control,” and “police misconduct” as difficult to discuss:
- Abortion (53% of female students vs. 45% of male students)
- Sexual assault (40% of female students vs. 29% of male students)
- Gun control (47% of female students vs. 39% of male students)
- Police misconduct (38% of female students vs. 32% of male students)
Differences between males and females on other topics were negligible.
Asian students were more likely than White, Hispanic, and Black students to report that they can have an open and honest conversation about most of the survey topics. For instance, only 30% of Asian students said it is difficult to discuss "transgender rights," while 46% of White students, 41% of Hispanic students, and 40% of Black students said the same. Thirty-three percent of Asian students said it is difficult to discuss the topic of “racial inequality,” whereas 43% of White students, 41% of Hispanic students, and 46% of Black students said the same. There are a few exceptions to this pattern. For instance, 21% of Asian students said it is difficult to discuss “China,” while 16% of White students, 14% of Hispanic students, and 11% of Black students said the same.
Responses also differ significantly by political identity. A greater percentage of conservative students than liberal students identified the following as topics difficult to have an open and honest conversation about:
- Abortion (59% of conservative students vs. 46% of liberal students)
- Freedom of speech (32% of conservative students vs. 22% of liberal students)
- Gay rights (44% of conservative students vs. 31% of liberal students)
- Gender inequality (41% of conservative students vs. 32% of liberal students)
- Gun control (48% of conservative students vs. 42% of liberal students)
- Racial inequality (46% of conservative students vs. 40% of liberal students)
- Religion (42% of conservative students vs. 36% of liberal students)
- Transgender rights (51% of conservative students vs. 38% of liberal students)
Moderate students were also more likely than liberal students to identify the following topics as difficult to discuss:
- Abortion (52% of moderate students vs. 46% of liberal students)
- Gay rights (36% of moderate students vs. 31% of liberal students)
- Transgender rights (44% of moderate students vs. 38% of liberal students)
Liberal students were more likely than moderate or conservative students to say that “the Israeli/Palestinian conflict” is difficult to discuss (30%, 22% and 21%, respectively). The same pattern held true for attitudes toward discussing the topic of “sexual assault,” which 38% of liberal students, 34% of moderate students, and 29% of conservative students said is difficult to discuss.[17]
We have asked this question every year since 2020, with some variation in the topics presented. Some topics, like “abortion” and “immigration,” were asked about every year, while others, like “freedom of speech” and “police misconduct,” were asked about at least twice. The table below presents topics that we have asked about multiple times.[18]
As you can see, the percentage of students identifying a topic as difficult to have an open and honest conversation about has, for the most part, remained fairly steady: For instance, in 2020, 41% of students identified “gun control” as difficult to discuss while, this year, 43% identified it that way.
The two topics that do not reflect this pattern are “abortion” and “racial inequality.” The percentage of students identifying the topic of “abortion” as difficult to discuss has increased by 4% since 2020, rising from 45% to 49%. In contrast, the percentage of students identifying “race” or “racial inequality”[19] as difficult to discuss peaked at 51% in 2021, the first time students were asked this question after the murder of George Floyd in 2020. It dropped to a low of 42% this year.
Table 8. Difficult topics to discuss on campus, 2020-present
| Topic | 2020 | 2021 | 2022 | 2023 |
|---|---|---|---|---|
| Abortion | 45% | 46% | 49% | 49% |
| Affirmative action | 30% | 29% | 26% | 23% |
| China | Not asked | 22% | 20% | 15% |
| Climate change | Not asked | 19% | 18% | 18% |
| Economic inequality | Not asked | 33% | 28% | 25% |
| Freedom of speech | Not asked | Not asked | 27% | 24% |
| Gender inequality | Not asked | 37% | 35% | 35% |
| Gun control | 41% | 44% | 43% | 43% |
| Immigration | 36% | 34% | 33% | 29% |
| Israeli-Palestinian conflict | 30% | 30% | 31% | 26% |
| Police misconduct | Not asked | Not asked | 43% | 36% |
| Race/Racial inequality | 43% | 51% | 48% | 42% |
| Religion | Not asked | Not asked | 37% | 38% |
| Sexual assault | Not asked | 38% | 37% | 35% |
| Transgender issues/ Transgender rights | 40% | 42% | 44% | 42% |
Tolerance of Controversial Speakers
Each year, thousands of lectures and invited talks are given on college campuses across the country without incident. Yet, some such events have produced controversy over the speakers’ views and previous remarks, resulting in attempts to deplatform the speaker. These deplatforming attempts include demands to silence speakers and/or those who invited them, calls for college officials to disinvite invited guest speakers, disruption of events, and even the use of violence to prevent expression from occurring.
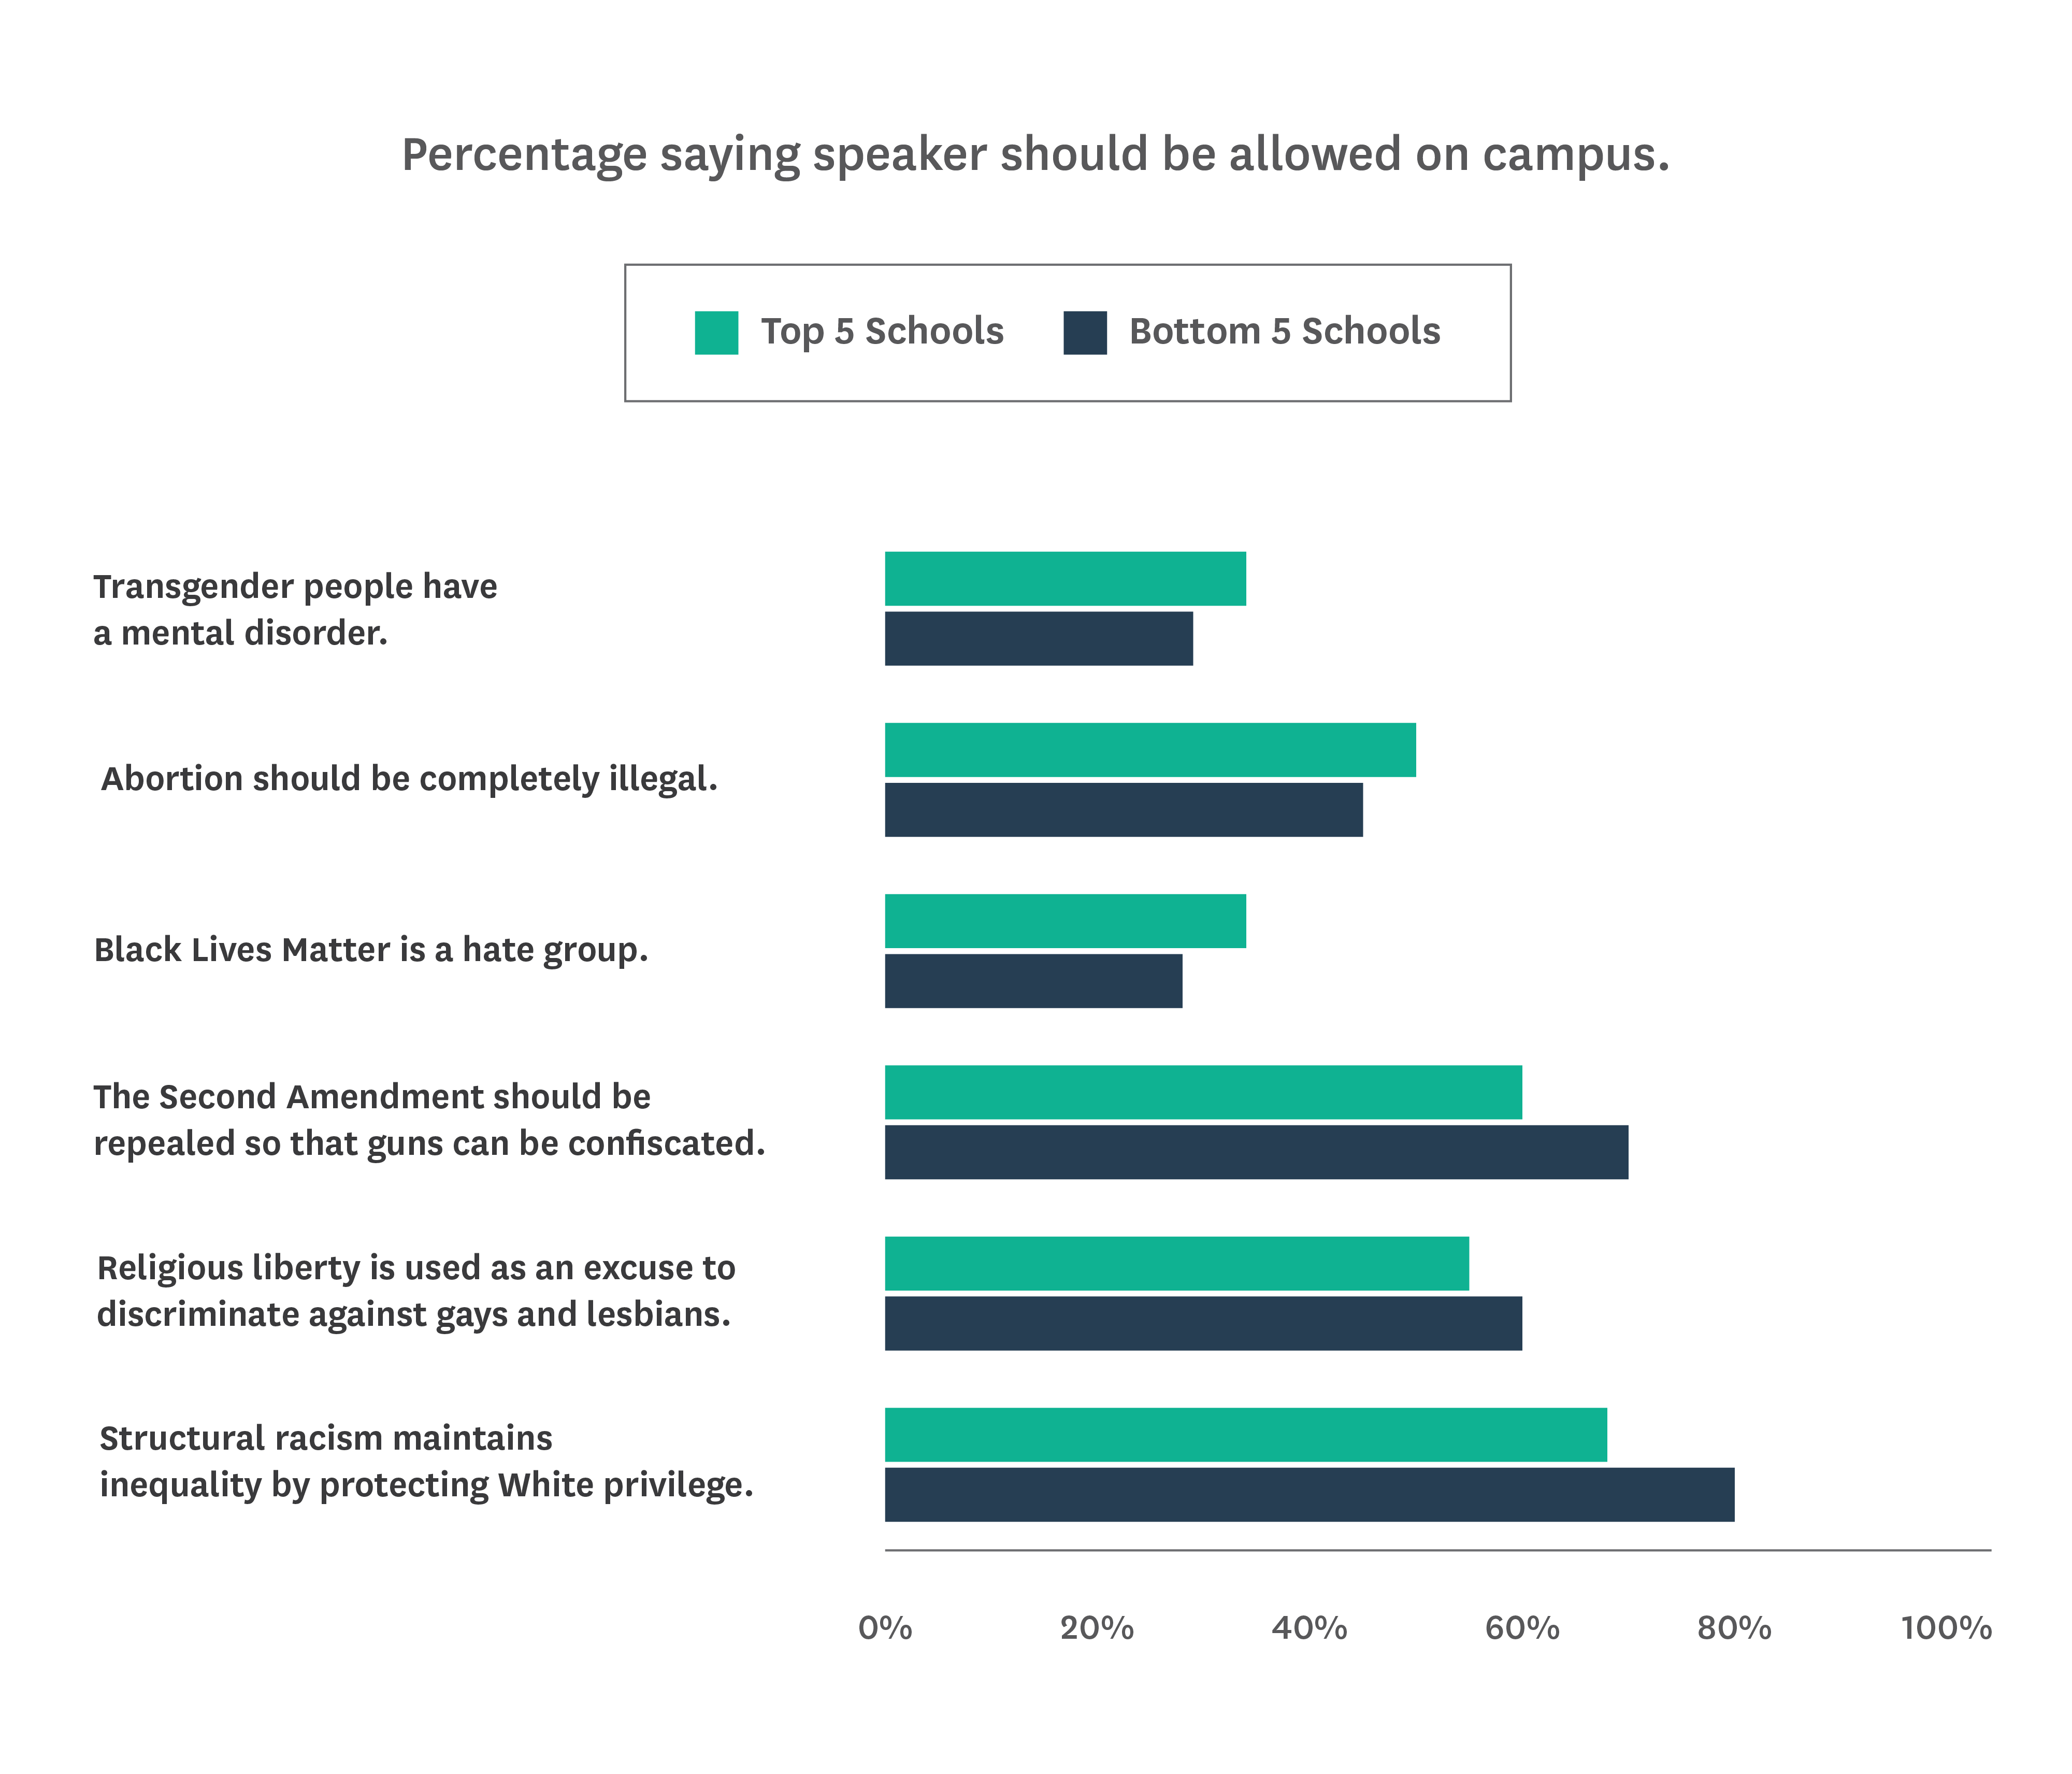
Political tolerance has long been assessed by asking people whether they would grant civil liberties — primarily freedom of speech — to nonconformists and controversial or offensive speakers.[20] Therefore, this survey asks students whether, regardless of their own views on the topic, their schools should allow a speaker on campus who has expressed one of the following six ideas:
- “Abortion should be completely illegal.”
- “Black Lives Matter is a hate group.”
- “Transgender people have a mental disorder.”
- “The Second Amendment should be repealed so that guns can be confiscated.”
- “Religious liberty is used as an excuse to discriminate against gays and lesbians.”
- “Structural racism maintains inequality by protecting White privilege.”
Overall, a majority of students responded that each liberal speaker should be allowed on campus, ranging from a low of 57% to a high of 72%. Students were consistently less supportive of allowing conservative speakers on campus: These percentages ranged from a high of 43% to a low of 29%. Supporters of free expression on campus should be concerned by these numbers. More than a quarter of students (28%) opposed allowing even the most popular speaker on the list — one who has expressed that “structural racism maintains inequality by protecting White privilege” — on campus, and the numbers were worse for the other speakers.
Responses also demonstrate consistent differences by sex, race, and political identification.[21]
A greater percentage of male students than female students would allow all six speakers on campus and, in most of the cases, these differences are stark.[22] For instance, 57% of male students responded that a speaker promoting the idea that “abortion should be completely illegal” should be allowed on campus, while only 33% of female students said the same. And 69% of male students said they would permit a speaker on campus who promoted the idea that “the Second Amendment should be repealed so that guns can be confiscated,” while 61% of female students said the same.
White students in general were more likely than Black, Hispanic, and Asian students to respond that each of the conservative speakers should be allowed on campus. This pattern largely reversed for the liberal speakers, with the exception of a speaker who expressed that “religious liberty is used as an excuse to discriminate against gays and lesbians” — 59% of White students said this speaker should be allowed on campus, whereas 53% of Hispanic students, 54% of Black students, and 52% of Asian students said the same.
Liberal students were more likely to support allowing each liberal speaker on campus than they were to allow each conservative speaker. Their support for allowing such speakers on campus ranged from 61% (“Religious liberty is used as an excuse to discriminate against gays and lesbians”) to 81% (“Structural racism maintains inequality by protecting White privilege”).
Liberal students were not as welcoming to conservative speakers, however. Only 16% of liberal students supported allowing a speaker on campus who expressed the view, “Black Lives Matter is a hate group”; 17% supported allowing a speaker who expressed the view, “Transgender people have a mental disorder”; and 32% supported allowing a speaker who expressed the view, “Abortion should be completely illegal.”
A majority of conservative students, on the other hand, said that all six speakers should be allowed on campus: These percentages ranged from a low of 55% (“Religious liberty is used as an excuse to discriminate against gays and lesbians”) to a high of 69% (“Abortion should be completely illegal”).
How Acceptable Is Engaging in Disruptive Conduct to Protest a Campus Speech?
Although most students oppose the use of disruptive tactics to stop a campus speech, disappointing percentages find such tactics acceptable to some degree (answering “always,” “sometimes,” or “rarely”).
Indeed, 45% of students, up from 37% last year, reported that blocking other students from attending a campus speech is at least rarely acceptable, while 27% of students, up from 20% last year, reported that using violence to stop a campus speech is at least rarely acceptable.
While shouting down a speaker is nonviolent, it is still disruptive and a threat to free expression. More than 3 in 5 students (63%) reported that this tactic is at least rarely acceptable, a percentage roughly the same as last year’s (62%).
Table 9: Acceptability of disruptive protest, 2021-present
| How acceptable would you say it is for students to engage in the following action to protest a campus speaker? | 2021 | 2022 | 2023 |
|---|---|---|---|
| Shouting down a speaker to prevent them from speaking on campus. | 66% | 62% | 63% |
| Blocking other students from attending a campus speech. | 41% | 37% | 45% |
| Using violence to stop a campus speech. | 24% | 20% | 27% |
Differences in students’ political identification correspond with the largest differences in their level of acceptance of disruptive conduct.[23] Almost 3 in 4 liberal students (74%) reported that shouting down a speaker is acceptable to some degree, whereas 58% of moderate students and 47% of conservative students said the same. Further, more than half of liberal students (52%) reported that blocking entry to a campus speech is acceptable to some degree. This represents an increase from 47% last year.
The percentages of moderate and conservative students reporting that blocking entry is acceptable to some degree also increased from those of last year. Last year, 31% of moderate students and 25% of conservative students reported that blocking entry is at least rarely acceptable: This year, 40% of moderate students and 33% of conservative students said the same.
This pattern also emerged when it comes to students’ level of acceptance of using violence to stop a campus speech. This year, 29% of liberal students, 26% of moderate students, and 23% of conservative students reported that violence is acceptable to some degree. Last year, 25% of liberal students, 18% of moderate students, and 16% of conservative students said the same.
Differences by sex are not as stark. For instance, 65% of female students reported that shouting down a speaker is acceptable to some degree, and 60% of male students said the same. As for blocking entry to a campus speech, 46% of female students reported that this tactic is acceptable to some degree, and 42% of male students said the same. Lastly, 25% of female students reported that using violence is acceptable to some degree and 28% of male students said the same.
Racial and ethnic differences are significant in this area.[24] While 41% of White students reported that blocking entry to a campus speech is acceptable to some degree, even larger proportions of Asian, Black, and Hispanic students reported the same:
- Asian students (56%)
- Black students (49%)
- Hispanic students (47%)
A smaller percentage of White students (22%) than that of Asian students (36%), Black students (34%), and Hispanic students (29%) also reported that using violence to stop a campus speech is acceptable to some degree.
How Do Students Perceive the Administration’s Support for Free Speech?
Students tended to report that their campus administration’s stance on protecting free speech is unclear at best. More than 2 in 5 students (43%) reported that it is only “somewhat” clear that their administration protects free speech on campus, while another 21% reported that this is not clear.
Additionally, 47% reported that it is only “somewhat” likely that the administration would defend a speaker’s right to express their views if a speech controversy occurred on campus. Another 27% reported that it is not likely that this would occur, and 26% said that it is likely.
Attempts to Sanction Scholars
FIRE’s Scholars Under Fire database covers expression-related incidents from 2000 to the present. It documents how and why scholars have faced calls for sanction, how scholars and institutional administrators have responded, and what (if any) sanctions scholars have experienced.[25] Schools included in the rankings received bonuses or penalties based on their responses to these kinds of controversies from 2019 through mid-2023.
At the colleges surveyed, 35 scholars who faced a call for sanction were supported rather than sanctioned by their administration. The following schools all supported scholars on more than one occasion:
- Carnegie Mellon
- George Washington University
- Stanford University
- University of California, Berkeley
- University of Chicago
In contrast, 149 scholars at the surveyed colleges were sanctioned. Some schools were particularly egregious offenders, with the following schools sanctioning scholars on at least three occasions:
Table 10: Schools with 3 or more sanctioned scholars.
| School | Sanctioned Scholars |
|---|---|
| University of Florida | 8 |
| Indiana University | 7 |
| University of Central Florida | 5 |
| George Washington University | 4 |
| Georgetown University | 4 |
| Harvard University | 4 |
| University of California, Los Angeles | 4 |
| University of North Carolina, Chapel Hill | 4 |
| University of Pennsylvania | 4 |
| Claremont McKenna College | 3 |
| Columbia University | 3 |
| San Diego State University | 3 |
| University of Arizona | 3 |
| University of Miami | 3 |
| University of Michigan | 3 |
| University of Texas, Austin | 3 |
| University of Wisconsin, Eau Claire | 3 |
| Yale University | 3 |
Put another way, 71 of the 149 scholar sanctions (48%) came from just 18 of the 254 schools surveyed.
Additionally, a number of schools sanctioned scholars on two occasions:
- Arizona State University
- Bowling Green State University
- Brigham Young University
- Chapman University
- Emory University
- George Mason University
- New York University
- Portland State University
- University of Colorado, Boulder
- University of Missouri, Columbia
- University of North Texas
- University of Oklahoma
- University of Rhode Island
- University of Washington
So, in total, 99 of the 149 scholar sanctions (66%) came from 33 of the 254 schools surveyed.
Disinvitation Attempts
FIRE’s Campus Disinvitation database documents efforts to disinvite speakers from public and private American institutions from 1998-present. Schools included in the rankings received bonuses for unequivocally defending a speaker’s right to free expression and received penalties for disinviting speakers from 2019 through mid-2023.[26]
Among the schools surveyed, 52 successful disinvitations were recorded: Among them were 26 substantial event disruptions, when one or more people substantially disrupt or entirely prevent a speaker from speaking or prevent an audience from hearing the speaker; 23 revocations, when a speaker’s invitation is rescinded; and three withdrawals, which occurred when a speaker cancels the event themself in response to the disinvitation campaign.
The following schools were each the site of more than one successful disinvitation and altogether accounted for 14 of the total successful disinvitations:
- Cornell University
- Dartmouth College
- Harvard University
- Saint Louis University
- University of California, Davis
- University of New Mexico
- University of South Carolina
In other words, more than a quarter of successful disinvitations (27%) came from just 7 of the 254 schools surveyed.
Among the schools surveyed, we recorded 29 instances of schools supporting speakers during a disinvitation campaign. The following schools all clearly defended a speaker’s rights during more than one disinvitation campaign:
- Arizona State University
- Georgetown University
- University of Michigan
- University of Pittsburgh
- University of Virginia
Conclusions
This year’s College Free Speech Rankings expanded to assess and rank the free expression environment at more than 250 colleges and universities in the United States — the most comprehensive such look to date. Through a multidimensional examination of students’ perceptions and experiences, and an even more comprehensive evaluation of campus speech controversies than that of our previous rankings reports, the College Free Speech Rankings helps students, parents, professors, administrators, alumni, policymakers, and any interested party identify the best and worst campuses for free speech in the United States.
This report adds tens of thousands of student voices and experiences to the discussion of free expression on America’s college campuses. The data and findings on how current students experience their campuses, what they say about their ability to express themselves in a variety of contexts, and how their school administrations handle speech controversies are publicly available at the College Free Speech Rankings dashboard, rankings.thefire.org, which offers the ability to make additional comparisons. The raw data file is also available by email request to data@thefire.org.
Although a handful of colleges stand out from the pack, the free speech climate at even these campuses has room to improve. For instance, Auburn University and Florida State University have consistently done well in the College Free Speech Rankings, and both are ranked in the top five this year. But both schools also sanctioned a professor in the past four years. All of the top five schools, with the exception of the University of New Hampshire, were middling at best on the components of “Comfort Expressing Ideas” and “Openness.” And the University of New Hampshire’s “Administrative Support” score is in the bottom half of schools surveyed.
Nationally, across all schools surveyed, less than half of students reported feeling comfortable expressing their views on controversial political issues on campus in a variety of contexts — such as in class, in common campus spaces, and on social media. One-fifth said they self-censor often and about a quarter said that they feel “a good deal” or “a great deal” of pressure to avoid discussing controversial topics in their classes.
At least 40% of students identified “abortion,” “gun control,” “racial inequality,” and “transgender rights” as topics that are difficult to have an open and honest conversation about on campus. When asked if controversial speakers should be allowed on campus, student support ranged from 29% to 72%, with only half of the six listed speakers receiving majority support.
The percentage of students who consider violent forms of protest to stop a campus speech acceptable to some degree increased over the past year: Forty-five percent said blocking other students from attending a speech is at least rarely acceptable, up from 37% last year, and 27% said that the use of violence to stop a speech is at least rarely acceptable, up from 20% last year.
These findings about intolerant and disruptive conduct and self-censorship suggest a pervasive national climate of worry and discomfort on American college campuses. This should concern anyone who supports a vision of higher education as a free marketplace of ideas meant to produce graduates who are ready to join the vigorous debates within American society and beyond.
Too many colleges are acquiescing to demands to deplatform students, scholars, and speakers on campus, perpetuating a climate hostile to free expression.
Appendices
Methodology
The College Free Speech Survey was developed by FIRE and administered by College Pulse. No donors to the project took part in designing or conducting the survey. The survey was fielded from January 13, 2023, to June 30, 2023. These data come from a sample of 55,102 undergraduates who were then enrolled full-time in four-year degree programs at one of a list of 254 colleges and universities in the United States. The margin of error for the U.S. undergraduate population is +/- 1 percentage point, and the margin of error for college student sub-demographics ranges from 2-5 percentage points.
The initial sample was drawn from College Pulse’s American College Student Panel™, which includes more than 750,000 verified undergraduate students and recent alumni from schools within a range of more than 1,500 two- and four-year colleges and universities in all 50 states. Panel members were recruited by a number of methods to help ensure student diversity in the panel population: These methods include web advertising, permission-based email campaigns, and partnerships with university-affiliated organizations. To ensure the panel reflects the diverse backgrounds and experiences of the American college population, College Pulse recruited panelists from a wide variety of institutions. The panel includes students attending large public universities, small private colleges, online universities, historically Black colleges such as Howard University, women’s colleges such as Smith College, and religiously-affiliated colleges such as Brigham Young University.
College Pulse uses a two-stage validation process to ensure that all its surveys include only students currently enrolled in two-year or four-year colleges or universities. Students are required to provide an “.edu” email address to join the panel and, for this survey, had to acknowledge that they are currently enrolled full-time in a four-year degree program. All invitations to complete surveys were sent using the student’s “.edu” email address or through a notification in the College Pulse app, available on iOS and Android platforms.
College Pulse applies a post-stratification adjustment based on demographic distributions from multiple data sources, including the Current Population Survey (CPS), the National Postsecondary Student Aid Study (NPSAS), and the Integrated Postsecondary Education Data System (IPEDS). The post-stratification weight rebalances the sample based on a number of important benchmark attributes, such as race, gender, class year, voter registration status, and financial aid status. The sample weighting is accomplished using an iterative proportional fitting (IFP) process that simultaneously balances the distributions of all variables. Weights are trimmed to prevent individual interviews from having too much influence on the final results.
The use of these weights in statistical analysis ensures that the demographic characteristics of the sample closely approximate the demographic characteristics of the target populations. Even with these adjustments, surveys may be subject to error or bias due to question wording, context, and order effects.
For further information, please see: https://collegepulse.com/methodology.
Free Speech Rankings
The College Free Speech Rankings are based on a composite score of 13 components, six of which assess student perceptions of different aspects of the speech climate on their campus. The other seven assess behavior by administrators, faculty, and students regarding free expression on campus. Higher scores indicate a better campus climate for free speech and expression.
Student Perceptions
The student perception components include:
- Comfort Expressing Ideas: Students were asked how comfortable they feel expressing their views on controversial topics in five different campus settings (e.g., “in class,” or “in the dining hall”). Options ranged from “very uncomfortable” to “very comfortable.” They were also asked how often they felt that they could not express their opinion because of how other students, faculty, or the administration would respond (options ranged from “never” to “very often”); how worried they are about damaging their reputation because of someone misunderstanding something they have said or done (options ranged from “worried a lot” to “not at all worried”); and if they feel pressure to avoid discussing controversial topics in their classes (options ranged from “no pressure at all” to “a great deal of pressure,” with “a lot of pressure” referring to the sum of “a good deal of pressure” and “a great deal of pressure”). Responses were coded so that higher scores indicate greater comfort expressing ideas. The maximum number of points is 33.
- Tolerance for Liberal Speakers: Students were asked whether three speakers espousing views potentially offensive to conservatives (e.g., “The Second Amendment should be repealed so that guns can be confiscated”) should be allowed on campus, regardless of whether they personally agree with the speaker’s message. Options ranged from “definitely should not allow this speaker” to “definitely should allow this speaker” and were coded so that higher scores indicate more tolerance of the speaker (i.e., more support for allowing the speaker on campus). The maximum number of points is 12.
- Tolerance for Conservative Speakers: Students were also asked whether three speakers espousing views potentially offensive to liberals (e.g., “Black Lives Matter is a hate group”) should be allowed on campus, regardless of whether they personally agree with the speaker’s message. Scoring was performed in the same manner as it was for the “Tolerance for Liberal Speakers” subcomponent, and the maximum number of points is 12.
- Disruptive Conduct: Students were asked how acceptable it is to engage in different methods of protest against a campus speaker, including “shouting down a speaker or trying to prevent them from speaking on campus,” “blocking other students from attending a campus speech,” and “using violence to stop a campus speech.” Options ranged from “always acceptable” to “never acceptable” and were coded so that higher scores indicate less acceptance of disruptive conduct. The maximum number of points is 12.
- Administrative Support: Students were asked how clear their campus administration’s stance on free speech is and how likely the administration would be to defend a speaker’s right to express their views if a controversy over speech occurred on campus. For the administrative stance question, options range from “not at all clear” to “extremely clear,” and for the administrative controversy question, options range from “not at all likely” to “extremely likely.” Options were coded so that higher scores indicate greater clarity and a greater likelihood of defending a speaker’s rights. The maximum number of points is 10.
- Openness: Finally, students were asked which of 20 issues (e.g., “abortion,” “freedom of speech,” “gun control,” and “racial inequality”), if any, are difficult to have open conversations about on campus. Responses were coded so that higher scores indicate fewer issues being selected. The maximum number of points is 20.
Two additional constructs, “Mean Tolerance” and “Tolerance Difference,” were computed from the “Tolerance for Liberal/Conservative Speaker” components. “Tolerance Difference” was calculated by subtracting “Tolerance for Conservative Speakers” from “Tolerance for Liberal Speakers” and then taking the absolute value (so that a bias in favor of either side would be treated the same).
Campus Indicators
Schools received bonus points — described in more detail below — for taking the following actions indicative of a positive campus climate for free speech:
- Supporting scholars whose speech rights were threatened during a free expression controversy, as recorded in FIRE's Scholars Under Fire database.[27] This support had to be unequivocal to be counted. That is, if an administration condemned the speech, apologized for the scholar’s expression, or sanctioned the scholar, despite issuing a statement of support, it was not included in the school’s total.
- Supporting students and student groups, as recorded in the “Supported Students and Student Groups” section of the appendix. As with supporting scholars, this support had to be unequivocal.
- Supporting speakers, as recorded in FIRE’s Campus Disinvitation database.[28] As with supporting scholars and students, this support had to be unequivocal.
Schools were penalized — described in more detail below — for taking the following actions indicative of poor campus climate for free speech:
- Sanctioning scholars (e.g., placing under investigation, suspending, or terminating scholars), as recorded in FIRE’s Scholars Under Fire database.
- Sanctioning students and student groups, as recorded in the “Sanctioned Students and Student Groups” section of the appendix.
- Successfully disinviting an invited speaker from speaking on campus, as recorded in FIRE’s Campus Disinvitation database.
To be included in this year’s rankings, an incident that would result in a bonus or penalty had to have occurred by July 12, 2023, and had to have been fully assessed by FIRE’s research staff, who determined whether the incident warranted inclusion. This means, for instance, that recent incidents at Texas A&M University — its recruitment and failed appointment of Kathleen McElroy as a tenured professor to run its journalism program, its placement of professor Joy Alonzo on paid administrative leave after her criticism of Lieutenant Governor Dan Patrick in a talk on political interference in higher education — are not included in this year’s rankings. Texas A&M University, therefore, was not penalized for either incident. However, the penalties will be applied in next year’s College Free Speech Rankings.
FIRE’s Spotlight Ratings — our ratings of the written policies governing student speech at more than 475 institutions of higher education in the United States — are also factored into each school’s overall score. Three substantive ratings are possible: “red light,” “yellow light,” and “green light.” A “red light” rating indicates that the institution has at least one policy that both clearly and substantially restricts freedom of speech. A “yellow light” rating indicates that an institution maintains policies that restrict a more limited amount of protected expression or that, by virtue of their vague wording, they could too easily be used to restrict protected expression. A “green light” rating indicates that an institution maintains no policies that seriously threaten speech, although this rating does not indicate whether a college actively supports free expression.
Finally, a fourth rating, “Warning,” is assigned to a private college or university when its policies clearly and consistently state that it prioritizes other values over a commitment to freedom of speech. “Warning” schools, therefore, were not ranked, and their overall scores are presented separately in this report.[29]
For this year’s rankings, the cutoff date for assessing a school’s speech code policies was July 12, 2023. Any changes to a school’s Spotlight rating that have occurred since then will be reflected in the 2025 College Free Speech Rankings.
Overall Score
To create an overall score for each college, we first summed the following student subcomponents: “Comfort Expressing Ideas,” “Mean Tolerance,” “Disruptive Conduct,” “Administrative Support,” and “Openness.” Then, we subtracted the “Tolerance Difference.” By including the “Mean Tolerance” (as opposed to including “Tolerance for Liberal Speakers” and “Tolerance for Conservative Speakers” separately) and subtracting the “Tolerance Difference,” the score accounted for the possibility that ideologically homogeneous student bodies may result in a campus that appears to have a strong culture of free expression but is actually hostile to the views of an ideological minority — whose views students may almost never encounter on campus.
Then, to further account for the speech climate on an individual campus, we incorporated behavioral components. A school earned up to one bonus point each time it successfully supported (i.e., did not sanction or release a conflicting message about) a scholar, student, or student group during a free expression controversy. We decreased this bonus by one quarter of a point each year, awarding a full point for support in 2023, three-quarters of a point for support in 2022, half a point for support in 2021, and one-quarter of a point for support in 2020.
We also applied penalties when an administration sanctioned a scholar, student, or student group, and when a speaker was disinvited from campus.
A school lost up to five points each time it sanctioned a scholar (e.g., investigated, suspended, or terminated a scholar). When the sanction did not result in termination the penalty was one point and was set to decrease by one-quarter of a point each year. penalizing schools a full point for sanctioning a scholar in 2023, three-quarters of a point for support in 2022, half a point for support in 2021, and one-quarter of a point for support in 2020. However, if the administration terminated the scholar, we subtracted three points, and if that scholar was tenured, we subtracted five points. These penalties are applied for four years before they begin to decrease, so schools that fired a tenured professor anytime between 2020 and 2023 lost five points. After a period of four years, these penalties begin to decrease by a quarter of a point each year. Therefore, schools that terminated scholars in 2019 are penalized in this year’s rankings. As of this year, the penalties have begun to decrease.
Regarding disinvitations, a school was penalized one point when an invited speaker withdrew because of the controversy caused by their upcoming appearance on campus. Like the penalty for sanctioning scholars, this penalty was set to decrease by a quarter of a point each year. However, if a school revoked a speaker’s invitation to visit campus or if a speaking event faced a substantial disruption, a school was penalized three points. As with scholar terminations, these penalties take effect for four years before they begin to decrease. Penalties related to revocations and substantial disruptions from 2019 are included in this year’s rankings. As of this year, the penalties have begun to decrease.
After we applied bonuses and penalties, we standardized each school’s score in each group — “Warning” schools and other schools — so that the average score in each group was 50.00 and the standard deviation was 10.00. Following standardization, we added one standard deviation to the final score of colleges whose speech codes received a “green light” rating. We also subtracted half a standard deviation from the final score of colleges that received a “yellow light” rating, one standard deviation from the final score of schools that received a “red light” rating, and two standard deviations from schools that received a “Warning” rating.
Overall Score = (50 + (ZRaw Overall Score)(10)) + FIRE Rating
2024 College Free Speech Rankings
| Rank | School | Overall Score | Speech Climate |
|---|---|---|---|
| 1 | Michigan Technological University | 78.01 | Good |
| 2 | Auburn University | 72.53 | Good |
| 3 | University of New Hampshire | 72.17 | Good |
| 4 | Oregon State University | 71.56 | Good |
| 5 | Florida State University | 69.64 | Above Average |
| 6 | University of Virginia | 68 | Above Average |
| 7 | Texas A&M University | 67.92 | Above Average |
| 8 | George Mason University | 67.65 | Above Average |
| 9 | University of North Carolina, Greensboro | 67.53 | Above Average |
| 10 | University of Colorado, Boulder | 66.54 | Above Average |
| 11 | North Carolina State University | 66.19 | Above Average |
| 12 | University of South Florida | 66.08 | Above Average |
| 13 | University of Chicago | 65.95 | Above Average |
| 14 | Mississippi State University | 65.61 | Above Average |
| 15 | Eastern Kentucky University | 65.51 | Above Average |
| 16 | Northern Arizona University | 65.34 | Above Average |
| 17 | University of Missouri, St. Louis | 64.88 | Above Average |
| 18 | Kansas State University | 63.35 | Above Average |
| 19 | University of Maryland | 63 | Above Average |
| 20 | Washington and Lee University | 62.99 | Above Average |
| 21 | University of North Carolina, Charlotte | 62.54 | Above Average |
| 22 | University at Buffalo | 62.2 | Above Average |
| 23 | Carnegie Mellon University | 61.47 | Above Average |
| 24 | East Carolina University | 59.68 | Slightly Above Average |
| 25 | New Jersey Institute of Technology | 58.87 | Slightly Above Average |
| 26 | James Madison University | 58.83 | Slightly Above Average |
| 27 | Georgia Institute of Technology | 58.7 | Slightly Above Average |
| 28 | Wright State University | 58.3 | Slightly Above Average |
| 29 | University of Illinois, Chicago | 58.22 | Slightly Above Average |
| 30 | Purdue University | 58.11 | Slightly Above Average |
| 31 | University of Toledo | 58.05 | Slightly Above Average |
| 32 | New Mexico State University | 57.75 | Slightly Above Average |
| 33 | California State University, Los Angeles | 57.38 | Slightly Above Average |
| 34 | College of Charleston | 57.26 | Slightly Above Average |
| 35 | Arkansas State University | 57.19 | Slightly Above Average |
| 36 | Appalachian State University | 56.91 | Slightly Above Average |
| 37 | University of Texas, El Paso | 56.24 | Slightly Above Average |
| 38 | University of Texas, Arlington | 56.16 | Slightly Above Average |
| 39 | University of Memphis | 56.14 | Slightly Above Average |
| 40 | Texas Tech University | 55.96 | Slightly Above Average |
| 41 | DePauw University | 55.93 | Slightly Above Average |
| 42 | Illinois Institute of Technology | 55.77 | Slightly Above Average |
| 43 | University of Alabama, Birmingham | 55.67 | Slightly Above Average |
| 44 | Colorado School of Mines | 55.59 | Slightly Above Average |
| 45 | Iowa State University | 55.49 | Slightly Above Average |
| 46 | Florida International University | 55.48 | Slightly Above Average |
| 47 | University of Michigan | 55.46 | Slightly Above Average |
| 48 | Oklahoma State University | 54.93 | Average |
| 49 | University of Texas, San Antonio | 54.82 | Average |
| 50 | Rowan University | 54.81 | Average |
| 51 | University of Colorado, Denver | 54.75 | Average |
| 52 | Ohio State University | 54.54 | Average |
| 53 | North Dakota State University | 54.41 | Average |
| 54 | Indiana University - Purdue University | 54.4 | Average |
| 55 | University of Iowa | 54.28 | Average |
| 56 | Ohio University | 54.16 | Average |
| 57 | University of Mississippi | 54.13 | Average |
| 58 | Johns Hopkins University | 53.95 | Average |
| 59 | The College of William & Mary | 53.69 | Average |
| 60 | University of Wisconsin, Madison | 53.57 | Average |
| 61 | University of California, Merced | 53.51 | Average |
| 62 | Clemson University | 53.38 | Average |
| 63 | University of Idaho | 53.3 | Average |
| 64 | Davidson College | 53.29 | Average |
| 65 | DePaul University | 53.18 | Average |
| 66 | University of Louisville | 53.16 | Average |
| 67 | Stony Brook University | 53 | Average |
| 68 | Boise State University | 52.92 | Average |
| 69 | Brown University | 52.86 | Average |
| 70 | Kenyon College | 52.85 | Average |
| 71 | Clarkson University | 52.83 | Average |
| 72 | University of Alabama, Huntsville | 52.79 | Average |
| 73 | Claremont McKenna College | 52.77 | Average |
| 74 | Colorado State University | 52.77 | Average |
| 75 | Oberlin College | 52.77 | Average |
| 76 | University of Tulsa | 52.69 | Average |
| 77 | Arizona State University | 52.66 | Average |
| 78 | Worcester Polytechnic Institute | 52.42 | Average |
| 79 | University of Kentucky | 52.39 | Average |
| 80 | Towson University | 52.3 | Average |
| 81 | Southern Illinois University, Carbondale | 51.92 | Average |
| 82 | University of Denver | 51.59 | Average |
| 83 | University of Kansas | 51.44 | Average |
| 84 | University of Arizona | 51.27 | Average |
| 85 | Howard University | 51.11 | Average |
| 86 | University of Illinois, Urbana-Champaign | 51.11 | Average |
| 87 | University of Nevada, Reno | 50.88 | Average |
| 88 | Wake Forest University | 50.8 | Average |
| 89 | Vanderbilt University | 50.78 | Average |
| 90 | Montclair State University | 50.52 | Average |
| 91 | Drexel University | 49.91 | Average |
| 92 | California State University, Fresno | 49.72 | Average |
| 93 | Wayne State University | 49.69 | Average |
| 94 | University of Nevada, Las Vegas | 49.66 | Average |
| 95 | Eastern Michigan University | 49.63 | Average |
| 96 | Temple University | 49.53 | Average |
| 97 | University of Tennessee | 49.49 | Average |
| 98 | Southern Methodist University | 49.23 | Average |
| 99 | University of Wisconsin, Milwaukee | 49.17 | Average |
| 100 | Texas State University | 49.15 | Average |
| 101 | University of Arkansas | 49.02 | Average |
| 102 | Miami University | 48.74 | Average |
| 103 | University of Minnesota | 48.7 | Average |
| 104 | Bucknell University | 48.59 | Average |
| 105 | West Virginia University | 48.58 | Average |
| 106 | University of Hawaii | 48.57 | Average |
| 107 | Syracuse University | 48.52 | Average |
| 108 | Pitzer College | 47.94 | Average |
| 109 | University of Southern California | 47.93 | Average |
| 110 | Illinois State University | 47.92 | Average |
| 111 | University of Georgia | 47.88 | Average |
| 112 | Missouri State University | 47.85 | Average |
| 113 | Kent State University | 47.63 | Average |
| 114 | University of Texas, Dallas | 47.46 | Average |
| 115 | Wesleyan University | 47.42 | Average |
| 116 | Stevens Institute of Technology | 47.35 | Average |
| 117 | University of Wyoming | 47.33 | Average |
| 118 | Swarthmore College | 47.21 | Average |
| 119 | Georgia State University | 47.16 | Average |
| 120 | Rutgers University | 47.11 | Average |
| 121 | University of Rochester | 46.96 | Average |
| 122 | Bowdoin College | 46.84 | Average |
| 123 | Occidental College | 46.65 | Average |
| 124 | Duke University | 46.58 | Average |
| 125 | University of California, San Diego | 46.53 | Average |
| 126 | University of California, Riverside | 46.48 | Average |
| 127 | Scripps College | 46.15 | Average |
| 128 | Case Western Reserve University | 46.13 | Average |
| 129 | Utah State University | 45.63 | Average |
| 130 | University of Pittsburgh | 45.62 | Average |
| 131 | Hamilton College | 45.61 | Average |
| 132 | University of Massachusetts | 45.57 | Average |
| 133 | University of California, Santa Cruz | 45.47 | Average |
| 134 | University of Oklahoma | 45.45 | Average |
| 135 | Washington University in St Louis | 45.26 | Average |
| 136 | Massachusetts Institute of Technology | 45.13 | Average |
| 137 | Knox College | 45.08 | Average |
| 138 | Brandeis University | 45.01 | Average |
| 139 | Colby College | 44.98 | Slightly Below Average |
| 140 | Louisiana State University | 44.53 | Slightly Below Average |
| 141 | University of Maine | 44.1 | Slightly Below Average |
| 142 | Montana State University | 44.07 | Slightly Below Average |
| 143 | University of Oregon | 44.01 | Slightly Below Average |
| 144 | California Institute of Technology | 43.85 | Slightly Below Average |
| 145 | Williams College | 43.8 | Slightly Below Average |
| 146 | University of Missouri, Kansas City | 43.75 | Slightly Below Average |
| 147 | University of California, Berkeley | 43.69 | Slightly Below Average |
| 148 | Lehigh University | 43.66 | Slightly Below Average |
| 149 | Wheaton College | 43.57 | Slightly Below Average |
| 150 | University of California, Irvine | 43.51 | Slightly Below Average |
| 151 | Washington State University | 43.45 | Slightly Below Average |
| 152 | Boston University | 43.44 | Slightly Below Average |
| 153 | University of Delaware | 43.19 | Slightly Below Average |
| 154 | University of Alabama, Tuscaloosa | 42.95 | Slightly Below Average |
| 155 | Mount Holyoke College | 42.94 | Slightly Below Average |
| 156 | Carleton College | 42.85 | Slightly Below Average |
| 157 | University of Houston | 42.44 | Slightly Below Average |
| 158 | Rice University | 42.37 | Slightly Below Average |
| 159 | Michigan State University | 42.27 | Slightly Below Average |
| 160 | Virginia Tech University | 42.17 | Slightly Below Average |
| 161 | Berea College | 42.15 | Slightly Below Average |
| 162 | Southern Illinois University, Edwardsville | 41.99 | Slightly Below Average |
| 163 | Furman University | 41.88 | Slightly Below Average |
| 164 | Barnard College | 41.83 | Slightly Below Average |
| 165 | California Polytechnic State University | 41.76 | Slightly Below Average |
| 166 | Trinity College | 41.71 | Slightly Below Average |
| 167 | Wellesley College | 41.62 | Slightly Below Average |
| 168 | Smith College | 41.61 | Slightly Below Average |
| 169 | University of California, Los Angeles | 41.51 | Slightly Below Average |
| 170 | Denison University | 41.12 | Slightly Below Average |
| 171 | University of San Francisco | 40.84 | Slightly Below Average |
| 172 | University of Nebraska | 40.62 | Slightly Below Average |
| 173 | University of California, Santa Barbara | 40.59 | Slightly Below Average |
| 174 | University of North Carolina, Chapel Hill | 40.21 | Slightly Below Average |
| 175 | Colorado College | 40.1 | Slightly Below Average |
| 176 | University of Notre Dame | 39.92 | Below Average |
| 177 | Pomona College | 39.78 | Below Average |
| 178 | University of Washington | 39.7 | Below Average |
| 179 | Harvey Mudd College | 39.66 | Below Average |
| 180 | Connecticut College | 39.59 | Below Average |
| 181 | University of Utah | 39.39 | Below Average |
| 182 | University of Vermont | 39.38 | Below Average |
| 183 | Tufts University | 39.27 | Below Average |
| 184 | Virginia Commonwealth University | 39.23 | Below Average |
| 185 | George Washington University | 39.21 | Below Average |
| 186 | San Jose State University | 39.18 | Below Average |
| 187 | Princeton University | 39.02 | Below Average |
| 188 | Clark University | 38.95 | Below Average |
| 189 | Pennsylvania State University | 38.93 | Below Average |
| 190 | SUNY at Albany | 38.66 | Below Average |
| 191 | Creighton University | 38.58 | Below Average |
| 192 | Santa Clara University | 38.47 | Below Average |
| 193 | Loyola University, Chicago | 38.09 | Below Average |
| 194 | SUNY College at Geneseo | 38.08 | Below Average |
| 195 | Amherst College | 37.85 | Below Average |
| 196 | Vassar College | 37.84 | Below Average |
| 197 | University of Missouri, Columbia | 37.83 | Below Average |
| 198 | Northeastern University | 37.82 | Below Average |
| 199 | Chapman University | 37.8 | Below Average |
| 200 | Bard College | 37.75 | Below Average |
| 201 | University of Wisconsin, Eau Claire | 37.62 | Below Average |
| 202 | Emory University | 37.49 | Below Average |
| 203 | Bowling Green State University | 37.45 | Below Average |
| 204 | University of Rhode Island | 37.28 | Below Average |
| 205 | University of Miami | 36.74 | Below Average |
| 206 | San Diego State University | 36.43 | Below Average |
| 207 | Stanford University | 36.32 | Below Average |
| 208 | Haverford College | 36 | Below Average |
| 209 | Colgate University | 35.83 | Below Average |
| 210 | University of Alaska | 35.82 | Below Average |
| 211 | Macalester College | 34.96 | Below Average |
| 212 | Cornell University | 34.94 | Below Average |
| 213 | Bates College | 34.87 | Below Average |
| 214 | Columbia University | 34.6 | Below Average |
| 215 | Western Michigan University | 34.44 | Below Average |
| 216 | University of Dayton | 33.83 | Below Average |
| 217 | Gettysburg College | 33.72 | Below Average |
| 218 | Lafayette College | 33.62 | Below Average |
| 219 | Franklin and Marshall College | 33.21 | Below Average |
| 220 | University of Connecticut | 33.2 | Below Average |
| 221 | University of North Texas | 32.96 | Below Average |
| 222 | University of Cincinnati | 32.9 | Below Average |
| 223 | Rensselaer Polytechnic Institute | 32.76 | Below Average |
| 224 | New York University | 32.26 | Below Average |
| 225 | Indiana University | 31.51 | Below Average |
| 226 | Grinnell College | 31.32 | Below Average |
| 227 | University of New Mexico | 31.22 | Below Average |
| 228 | Binghamton University | 30.92 | Below Average |
| 229 | Boston College | 29.94 | Poor |
| 230 | Marquette University | 29.6 | Poor |
| 231 | University of Florida | 29.37 | Poor |
| 232 | Portland State University | 27.88 | Poor |
| 233 | Middlebury College | 27.63 | Poor |
| 234 | Yale University | 26.73 | Poor |
| 235 | University of Central Florida | 26.64 | Poor |
| 236 | Central Michigan University | 26.61 | Poor |
| 237 | University of California, Davis | 26.42 | Poor |
| 238 | Tulane University | 26.4 | Poor |
| 239 | University of Texas, Austin | 26.38 | Poor |
| 240 | Dartmouth College | 25.76 | Poor |
| 241 | Duquesne University | 25.25 | Poor |
| 242 | Northwestern University | 23.95 | Poor |
| 243 | Skidmore College | 23.59 | Poor |
| 244 | Fordham University | 21.72 | Poor |
| 245 | Georgetown University | 17.45 | Very Poor |
| 246 | University of South Carolina | 12.24 | Very Poor |
| 247 | University of Pennsylvania | 11.13 | Very Poor |
| 248 | Harvard University | 0 | Abysmal |
Supported Students and Student Groups
| Year | School | Supported Student(s)/Student Group(s) | Controversy Explanation |
|---|---|---|---|
| 2021 | Arizona State University | Kyle Rittenhouse | Students started a petition to prevent the controversial acquitted shooter from attending the university. |
| 2021 | Arizona State University | Daniel Lopez, Konya Saidu, and Jaafar Al Shamari | Candidates for student government submitted a complaint against three students allegedly involved in an online smear campaign, accusing them of harassment and violating the student code of conduct. |
| 2020 | Louisiana State University | Drew Dollar | The student faced petitions and other calls for sanction after actress/activist Skai Jackson shared a video on Twitter of him using a racial slur. |
| 2020 | Missouri State University | Holland Easterla | The incoming student faced calls for sanction after a video was shared on social media. |
| 2020 | Pennsylvania State University | Sean Setnick | Students and alumni sought disciplinary action against the student, who was accused of shouting an ethnic slur while driving by a protest. |
| 2020 | Princeton University | Tyler Eddy | After using a racial slur in a social media post, the student faced a petition demanding he face a disciplinary hearing. |
| 2020 | Temple University | Peyton Mulder | After posting a political social media post, the student faced calls on social media for the administration to remove her from her sorority and to sanction her. |
| 2020 | Temple University | Drew Sella | The student faced calls for expulsion after a social media post. |
| 2020 | Temple University | Angelina Truong | The student faced calls for expulsion after a social media post. |
| 2020 | Temple University | Zoe Conte | The student faced calls for sanction after a social media post. |
| 2020 | Temple University | Gabe Escobar | The student faced calls for sanction after a social media post. |
| 2022 | University of Kansas | Niya D. McAdoo | A state representative called on the campus community to censor the student for her controversial speech. |
| 2021 | University of Minnesota | Lauren Meyers | The student urged fellow students to do illegal acts as a form of protest, then faced calls for the administration to investigate her and require her to apologize. |
| 2022 | University of North Texas | Kelly Neidert | After refusing to use other students’ preferred pronouns and speaking out on a controversial topic, the student faced a petition calling for her expulsion. |
| 2021 | University of Southern California | Yasmeen Mashayekh | In response to the student's social media post, a letter signed by more than 60 USC faculty members was circulated. It urged the university’s leadership to “publicly and explicitly rebuke” her. |
| 2022 | Arizona State University | College Republicans United | The student group wanted to bring Jared Taylor to campus, and it faced a social media campaign to have its event canceled. |
| 2022 | Arizona State University | Palestine Cultural Club, Students for Justice in Palestine | The student group wanted to co-host an event featuring Mohammed El-Kurd, and it faced attempts to prevent the school from funding the event, attempts to censor the content of the speaker's speech, and a letter-writing campaign aimed at convincing the university administration to intervene. |
| 2022 | Auburn University | Turning Point USA | After an unaffiliated individual held an event on campus under the student group's name without the permission of the national chapter, students called on the administration to condemn hate speech. |
| 2022 | California Polytechnic State University, San Luis Obispo | College Republicans | A student group faced attempted censorship from fellow students for its pro-life display. |
| 2020 | Case Western Reserve University | Students for Life (Case for Life) | The student group was approved by the student government, then denied recognition through a student body referendum. |
| 2021 | Clemson University | Turning Point USA | The student group faced multiple attempts to censor its planned on-campus event featuring Tomi Lahren, Brandon Tatum, and Graham Allen. The attempts included a petition to prevent the speakers from coming to campus and efforts from faculty members to reserve tickets for the event in order to fill up available seats, preventing students who may have wanted to attend from doing so. |
| 2022 | Cornell University | Network of Enlightened Women | The student group faced multiple attempts to censor its planned on-campus event featuring Ann Coulter. The attempts included a petition to prevent Coulter from coming to campus and multiple disruptions during the event, which led to it ending early. |
| 2020 | Emory University | Emory Medical Students for Life | The student group faced attempts to censor its planned on-campus event featuring Toni McFadden. The attempts included an open letter with more than 40 signatures suggesting the event should be canceled. |
| 2021 | Florida State University | College Republicans at FSU | The student group faced opposition for its planned on-campus event featuring Ben Shapiro. The opposition included vandalism of its promotional materials, an organized effort to get Shapiro’s invitation revoked, and a protest at the event. The event proceeded as planned. |
| 2020 | Georgetown University | Students for Justice in Palestine | The student group wanted to organize a virtual event featuring Miko Peled, and it faced an unsuccessful petition to cancel its event. |
| 2022 | Georgetown University | Georgetown Law Students for Justice in Palestine | The student group wanted to bring Mohammed El-Kurd to campus, and it faced opposition including an unsuccessful email campaign to get the event canceled. |
| 2022 | Gettysburg College | Young Americans for Freedom | The student group wanted to bring Ryan Anderson to campus, and it faced opposition from the student government, who denied the event funding. The group’s promotional materials were also vandalized, and an unsuccessful petition to have the event canceled was circulated. |
| 2022 | Harvard University | Palestine Solidarity Committee | The student group co-sponsored an event that would bring Mohammed El-Kurd to campus. It faced opposition including some vocal attempts to get the administration to condemn and/or cancel the event and a non-disruptive protest. |
| 2020 | Iowa State University | Students for Trump | The student group faced calls for its removal due to claims of offensive and harassing speech. |
| 2020 | Iowa State University | College Republicans | The duly recognized student group faced calls for its dissolution because of the content of its speech. |
| 2023 | James Madison University | Young Americans for Freedom | The student group wanted to bring Liz Wheeler to campus, and it faced opposition including protests against the speaker coming to campus and a petition to cancel the event. |
| 2023 | Kent State University | College Republicans | After painting “What is a Woman?” on a rock to promote its event featuring a viewing of a documentary by the same name, the student group’s internal messages were leaked and it faced a petition calling on the administration to take action against it. |
| 2023 | Michigan Technological University | Turning Point USA | The student group wanted to bring Brandon Tatum to campus, and it faced opposition including a successful petition asking the student government not to fund the event. |
| 2023 | New York University | Jewish Law Students Association | The student group wanted to bring Michal Cotler-Wunsh to campus, and it faced opposition including calls to cancel the event and a disruption at the beginning of the event. |
| 2023 | Northwestern University | College Republicans and Young Americans for Freedom | Shortly after co-hosting an event featuring James Lindsay, the student group faced a funding freeze imposed by the student government. |
| 2021 | Pennsylvania State University | Uncensored America | The student group faced opposition for its planned on-campus event featuring Milo Yiannopoulos: A petition to prevent the event from occurring was circulated, bias complaints against the group were made, and a call was made to have the group's university recognition revoked. |
| 2021 | Stony Brook University | Turning Point USA | The student group faced a petition calling on the administration to deny its request for recognition. |
| 2022 | University at Buffalo | Young Americans for Freedom | The student club faced multiple obstacles concerning hosting its event featuring Allen West: Its promotional materials were destroyed and it faced calls to have the event canceled. |
| 2023 | University at Buffalo | Young Americans for Freedom | Three faculty members wrote an open letter requesting that the president of the university cancel the student group for its planned event featuring Michael Knowles. |
| 2022 | University of California, Berkeley | Anti-Zionism Law Student Groups | The cohort of student groups whose bylaws included strict associative restrictions of its members faced calls for the university to defund it. |
| 2023 | University of California, Davis | Turning Point USA | A professor called on the university to cancel the student group's event featuring Charlie Kirk. |
| 2022 | University of California - San Diego | Students for Justice in Palestine | After the student group invited Taher Herzallah to campus, calls came for the administration to cancel the event and condemn the speaker. |
| 2023 | University of Denver | Federalist Society | The student group faced calls to have its event featuring Ilya Shapiro canceled. |
| 2022 | University of Houston | Young Conservatives of Texas | The student group faced efforts to interfere with its event featuring Matt Walsh: Its promotional materials were destroyed and a petition asking the university to cancel the event was circulated. |
| 2023 | University of Illinois, Chicago | Turning Point USA | Students created a petition calling on administrators to cancel an event hosted by the student group featuring Charlie Kirk and Candace Owens. |
| 2022 | University of Illinois, Urbana-Champaign | Young Americans for Freedom | Activist groups called on the university to cancel the student group’s event featuring pro-Palestinian speakers. |
| 2020 | University of Michigan | Midwest Students for Justice in Palestine, Palestinian Youth Movement, and Students Allied for Freedom and Equality | An off-campus organization called on the administration to condemn the statements of pro-Palestinian protesters and to investigate and consider sanctioning the student groups that organized the protest. |
| 2021 | University of Nevada, Las Vegas | Turning Point USA | The student group faced calls for its removal because its parent organization, Turning Point Action, allegedly provided transportation and hotel rooms to people involved in the events of January 6. |
| 2023 | University of New Hampshire | Free Exercise Coalition | The student group faced calls for the withdrawal of its formal recognition after claims that its activities were making LGBTQ+ students unsafe. |
| 2022 | University of New Mexico | Turning Point USA | The student group’s event featuring Tomi Lahren was disrupted and the group faced a petition calling on the administration to revoke its recognition. |
| 2022 | University of North Carolina, Chapel Hill | All Pro-Life Student Organizations | Student government leadership prohibited student groups from using their funds to support individuals, businesses, or organizations that advocate for restricting reproductive healthcare. |
| 2022 | University of North Carolina, Greensboro | Young Americans for Freedom | The student group faced a petition calling for its removal after it made a social media post featuring a quotation from Ben Shapiro about transgenderism. |
| 2020 | University of North Texas | The North Texas Daily | An off-campus organization officially requested that the university provide a student reporter’s unpublished materials related to a story it considered objectionable and biased. |
| 2022 | University of North Texas | Young Conservatives of Texas | The student group’s event featuring Jeffrey Younger was disrupted and the group faced calls for its removal. |
| 2020 | University of Oklahoma | Turning Point USA | The student group faced calls for the cancellation of its event featuring Ann Coulter. The student government allegedly attempted to remove the group’s recognition. |
| 2023 | University of Pittsburgh | Turning Point USA & College Republicans | The student groups faced a petition calling for the cancellation of their events featuring Cabot Phillips, Riley Gaines, and Michael Knowles. |
| 2022 | University of Vermont | Revolutionary Socialist Union | The unofficial student group was reported to the administration over its bylaws, which required members to pledge “NO” to Zionism. |
| 2020 | University of Wisconsin, Madison | Panhellenic and Interfraternity Council Greek Life Organizations | Students called for the abolition of Panhellenic and Interfraternity Council Greek organizations on campus because of their history of exclusionary practices and controversial speech. |
| 2022 | University of Wisconsin, Madison | Young Americans for Freedom | Bias reports were filed against the student group for its planned event featuring Matt Walsh. The group’s promotional materials were also vandalized, and it faced a call to have the event canceled. |
| 2020 | Vanderbilt University | All Greek Organizations at Vanderbilt | Students wrote a petition to ban all campus Greek organizations in the name of social justice. |
| 2022 | Virginia Tech | Virginia Tech Graduate and Professional Student Senate | Students petitioned the administration to condemn Steven Salaita ahead of his appearance at an event hosted by the student group. |
| 2023 | Washington and Lee University | W&L Spectator and College Republicans | Student groups faced opposition to their co-hosted event featuring Matt Walsh. Their promotional materials were vandalized and a petition to have the event canceled was circulated. |
| 2021 | Wellesley College | Wellesley for Life | The student group faced opposition for hosting Kristan Hawkins. A publically available document providing a template for complaints to the administration calling for, among other things, cancellation of the event and revoking the event sponsor's official student group status was circulated. |
| 2022 | Yale University | Federalist Society | The student group’s event featuring Monica Miller and Kristen Waggoner was disrupted by protesters who made it difficult for those in attendance to hear. |
Sanctioned Students and Student Groups
| Year | School | Sanctioned Student(s)/Student Group(s) | Controversy Explanation |
|---|---|---|---|
| 2020 | Fordham University | Austin Tong | The student, who made politically controversial social media posts, was investigated and put on disciplinary probation by the university. As part of the probation, the student was banned from extracurriculars, student office, student groups and sports in the upcoming school year. |
| 2023 | Georgetown University | William Spruance | The university retaliated against the student, who criticized its policies, by suspending him, ordering him to submit to psychiatric evaluation, and scheduling a conduct hearing. |
| 2020 | Harvard University | Kyle Kashuv | The university rescinded its admission of the prospective student after his social media posts from two years earlier surfaced. |
| 2020 | Marquette University | Leah Zenk | The prospective student had her admission and athletic scholarship rescinded following an offensive social media post. |
| 2020 | Portland State University | Lindy Treece | The student was censored during Zoom class and admonished by her professor for using a derogatory term. |
| 2020 | Purdue University | Maxwell Lawrence | The student was expelled for allegedly threatening social media posts. |
| 2021 | Stanford University | Chaze Vinci | Following racist and allegedly threatening social media posts, the student’s peers petitioned to have him expelled, and the university banned the student from campus. |
| 2021 | SUNY College at Geneseo | Owen Stevens | The student was suspended from mandatory field experiences needed for his teaching degree after making allegedly threatening social media posts. |
| 2022 | Syracuse University | Eriendeep Uppal | The student was suspended and required to do community service and training after, in her capacity as orientation leader, she organized voluntary activities which some university administrators felt were dangerous or could make students uncomfortable. |
| 2022 | University of Florida | Marcus Stokes | The prospective student’s athletic scholarship was revoked after he made a social media post. |
| 2020 | University of Louisville | Austin Clark | The student claimed that the university administration did nothing when he complained that he was being harassed for his political point of view. The student has sued the university for alleged discrimination against his pro-life views. |
| 2020 | University of Missouri | Annelise Ahrens | An incoming student was suspended during an administrative investigation of a video shared on social media. |
| 2020 | University of New Mexico | Joseph Caldwell | After facing an allegation of battery, the student was evicted from student housing, banned from his sports team, and prohibited from registering for classes, all without a hearing. |
| 2023 | University of North Carolina, Chapel Hill | Jamie Marsicano | After participating in an off-campus protest, the university used the student having been charged with vandalism as a pretext to ban him from campus for his controversial activism. |
| 2020 | University of Tennessee | Mimi Groves | The prospective student was removed from the university cheer team and withdrew from the team after a three-year-old video of her using a racial slur surfaced. |
| 2021 | Virginia Tech | Sean Lohr | An athletics director forced the student and whole athletic fan club, of which he was a part, to leave a game for being too boisterous. The student, who responded with an insult, was later officially disciplined for being disruptive. |
| 2021 | Washington State University | Kassidy Woods | The student athlete was told his participation in a particular political movement would make things hard for him. The student noticed that his ability to register for classes and resources were curtailed when he entered the transfer portal. |
| 2020 | Amherst College | Men's Lacrosse Team | Student athletes involved in multiple offensive speech incidents were punished by the administration. The administration put them on probation, prohibited them from attending formal group gatherings, and forced them to complete diversity training. |
| 2020 | Baylor University | Turning Point USA | The university rejected the student group's repeated attempts to obtain official registration based on the group's controversial views, giving the pretext that there were already three similar approved groups on campus. |
| 2022 | Berea College | The Berea Torch | The independent student newspaper faced university sanctions after publishing articles about the campus climate. The sanctions included being denied access to paid printing services available to all students and being prohibited from posting flyers publicizing the paper. |
| 2021 | Fordham University | Students for Justice in Palestine | The administration revoked the recognition of the pro-Palestinian student group over its political beliefs. |
| 2021 | Hamilton College | Rosary Club | The student club was asked to run all of its communications and events by a university administrator for content approval. |
| 2022 | Iowa State University | Men's Lacrosse Team | The student group had its vehicle use privileges suspended after a photo was published of the vehicle parked outside a marijuana dispensary. |
| 2022 | Lafayette College | Students for Justice in Palestine | The university denied the student group's application for official recognition after expressing concern about events by other chapters at different institutions, as well as about how the group's proposed activities might “target/disrupt other clubs or individuals on campus.” |
| 2021 | Northwestern University | Greek Life at Northwestern | Students called for the abolition of all Greek student organizations after alleged sexual assaults occurred at a fraternity. |
| 2023 | Pennsylvania State University | The Daily Collegian | The administration cut the independent student newspaper’s funding by more than 50%. |
| 2022 | Texas A&M University | The Battalion | The university put the independent student newspaper under the supervision of the journalism department and told it to move the paper online. |
| 2022 | Tulane University | Phi Gamma Delta | The student group was punished for engaging in offensive speech on an internal document which was leaked to the campus newspaper. |
| 2023 | University of Chicago | Turning Point USA | The student group was denied recognition for its views under the pretext that it hadn't shown enough interest and that another similar group had already been recognized. |
| 2021 | University of Florida | Turning Point USA, Young Americans for Freedom, & Network of Enlightened Women | Student groups were punished with suspensions for violating COVID-19 policies at a food function where masks had to be removed to eat. |
| 2020 | University of Pennsylvania | Hunting, Archery, and Shooting Club | The university delayed approving the student group, claiming that due to the "nature of the group's mission" it could not make an approval decision until campus returned to normal operations post-COVID-19. However, other groups intending to meet in person were approved during the pandemic. |
| 2023 | University of South Carolina | Uncensored America | The student group was denied recognition under the pretext of being similar to an already existing group when the university regularly approved groups with similar missions. |
| 2023 | University of Tennessee | Sigma Phi Epsilon | The university punished the student group for allegedly committing multiple student conduct violations. The punishment restricted the group’s ability to recruit or gather as a group and the ability of its members to wear or display group symbols. |
| 2022 | University of Utah | Greek Life at University of Utah | All Greek groups were suspended after two were accused of crimes. |
Survey Questions and Topline Results
Note: The survey asked additional questions that were not included in the calculation of the College Free Speech Rankings. The data for these questions will be released in a separate set of analyses.
How comfortable would you feel doing the following on your campus? [Presented in randomized order]
Publicly disagreeing with a professor about a controversial political topic.
- 33% Very uncomfortable
- 36% Somewhat uncomfortable
- 23% Somewhat comfortable
- 9% Very comfortable
Expressing disagreement with one of your professors about a controversial political topic in a written assignment.
- 21% Very uncomfortable
- 34% Somewhat uncomfortable
- 32% Somewhat comfortable
- 14% Very comfortable
Expressing your views on a controversial political topic during an in-class discussion.
- 23% Very uncomfortable
- 34% Somewhat uncomfortable
- 31% Somewhat comfortable
- 11% Very comfortable
Expressing your views on a controversial political topic to other students during a discussion in a common campus space such as a quad, dining hall, or lounge.
- 20% Very uncomfortable
- 33% Somewhat uncomfortable
- 34% Somewhat comfortable
- 14% Very comfortable
Expressing an unpopular political opinion to your fellow students on a social media account tied to your name.
- 36% Very uncomfortable
- 34% Somewhat uncomfortable
- 21% Somewhat comfortable
- 9% Very comfortable
On your campus, how often have you felt that you could not express your opinion on a subject because of how students, a professor, or the administration would respond?
- 14% Never
- 36% Rarely
- 30% Occasionally, once or twice a month
- 14% Fairly often, a couple of times a week
- 6% Very often, nearly every day
How worried are you about damaging your reputation because someone misunderstands something you have said or done?
- 14% Not at all worried
- 30% Not very worried
- 39% Worried a little
- 16% Worried a lot
How much pressure do you feel to avoid discussing controversial topics in your classes?
- 28% No pressure at all
- 46% Some pressure
- 18% A good deal of pressure
- 7% A great deal of pressure
How acceptable would you say it is for students to engage in the following action to protest a campus speaker? [Presented in randomized order]
Shouting down a speaker to prevent them from speaking on campus.
- 5% Always acceptable
- 26% Sometimes acceptable
- 32% Rarely acceptable
- 37% Never acceptable
Blocking other students from attending a campus speech.
- 3% Always acceptable
- 15% Sometimes acceptable
- 26% Rarely acceptable
- 55% Never acceptable
Using violence to stop a campus speech.
- 2% Always acceptable
- 9% Sometimes acceptable
- 16% Rarely acceptable
- 73% Never acceptable
How clear is it to you that your college administration protects free speech on campus?
- 5% Extremely clear
- 16% Very clear
- 43% Somewhat clear
- 26% Not very clear
- 10% Not at all clear
If a controversy over offensive speech were to occur on your campus, how likely is it that the administration would defend the speaker’s right to express their views?
- 6% Not at all likely
- 21% Not very likely
- 47% Somewhat likely
- 19% Very likely
- 7% Extremely likely
Student groups often invite speakers to campus to express their views on a range of topics. Regardless of your own views on the topic, should your school ALLOW or NOT ALLOW a speaker on campus who promotes the following idea? [Presented in randomized order]
Transgender people have a mental disorder.
- 44% Definitely should not allow this speaker
- 27% Probably should not allow this this speaker
- 17% Probably should allow this speaker
- 12% Definitely should allow this speaker
Abortion should be completely illegal.
- 29% Definitely should not allow this speaker
- 28% Probably should not allow this this speaker
- 27% Probably should allow this speaker
- 16% Definitely should allow this speaker
Black Lives Matter is a hate group.
- 42% Definitely should not allow this speaker
- 29% Probably should not allow this this speaker
- 17% Probably should allow this speaker
- 12% Definitely should allow this speaker
The Second Amendment should be repealed so that guns can be confiscated.
- 9% Definitely should not allow this speaker
- 26% Probably should not allow this this speaker
- 43% Probably should allow this speaker
- 21% Definitely should allow this speaker
Religious liberty is used as an excuse to discriminate against gays and lesbians.
- 18% Definitely should not allow this speaker
- 25% Probably should not allow this this speaker
- 35% Probably should allow this speaker
- 22% Definitely should allow this speaker
Structural racism maintains inequality by protecting White privilege.
- 11% Definitely should not allow this speaker
- 17% Probably should not allow this this speaker
- 38% Probably should allow this speaker
- 34% Definitely should allow this speaker
This next series of questions asks you about self-censorship in different settings. For the purpose of these questions, self-censorship is defined as follows:
Refraining from sharing certain views because you fear social (e.g., exclusion from social events), professional (e.g., losing job or promotion), legal (e.g., prosecution or fine), or violent (e.g., assault) consequences, whether in person or remotely (e.g., by phone or online), and whether the consequences come from state or non-state sources.
How often do you self-censor during conversations with other students on campus?
- 10% Never
- 32% Rarely
- 33% Occasionally, once or twice a month
- 18% Fairly often, a couple of times a week
- 7% Very often, nearly every day
How often do you self-censor during conversations with your professors?
- 11% Never
- 31% Rarely
- 32% Occasionally, once or twice a month
- 18% Fairly often, a couple of times a week
- 9% Very often, nearly every day
How often do you self-censor during classroom discussions?
- 9% Never
- 30% Rarely
- 33% Occasionally, once or twice a month
- 19% Fairly often, a couple of times a week
- 9% Very often, nearly every day
Compared to when you started college, are you now more or less likely to self-censor on campus?
- 8% Much less likely
- 23% Less likely
- 44% About the same
- 17% More likely
- 8% Much more likely
Some students say it can be difficult to have conversations about certain issues on campus. Which of the following issues, if any, would you say are difficult to have an open and honest conversation about on your campus? [Percentage selecting each option]
- 49% Abortion
- 23% Affirmative action
- 15% China
- 18% Climate change
- 18% Crime
- 25% Economic inequality
- 24% Freedom of speech
- 35% Gay rights
- 35% Gender inequality
- 43% Gun control
- 29% Immigration
- 13% Inflation
- 26% The Israeli/Palestinian conflict
- 36% Police misconduct
- 42% Racial inequality
- 38% Religion
- 35% Sexual assault
- 17% The Supreme Court
- 42% Transgender rights
- 15% War in Ukraine
- 17% None of the above
- In politics today, do you consider yourself a Republican, Democrat, or something else?
- 17% Strong Democrat
- 14% Weak Democrat
- 20% Independent, lean Democrat
- 18% Independent
- 10% Independent, lean Republican
- 6% Weak Republican
- 6% Strong Republican
- 9% Something else [write-in]
Using the following scale, how would you describe your political beliefs?
- 19% Very liberal
- 19% Somewhat liberal
- 10% Slightly liberal
- 14% Moderate, middle-of-the-road
- 6% Slightly conservative
- 8% Somewhat conservative
- 5% Very conservative
- 9% I do not identify as a liberal or a conservative
- 9% Haven’t thought much about this
[If “I do not identify as a liberal or a conservative” is selected]: Which of the following best describes your political beliefs?
- 3% Democratic Socialist
- 2% Libertarian
- 5% Something else [write-in]
Endnotes
[1]Colleges whose speech policies received a Warning rating from FIRE were given a rank of Warning (see Methodology). We do, however, present their overall scores in this report. These scores were standardized separately from non-Warning schools so that the overall scores of Warning schools were computed only in comparison to each other. As a result, 248 schools received a ranking this year.
[2]See previous footnote for a description of why only 248 of the 254 schools surveyed were ranked.
[3]This report includes only the main campus of Texas A&M University located in College Station, Texas. Other schools within the Texas A&M system are not part of this report.
[4]t(8) = 0.30, p = 0.77.
[5]t(8) = 0.18, p = 0.86.
[6]t(8) = 3.11, p = 0.02.
[7]t(8) = 1.40, p = 0.20 for “Tolerance for Controversial Conservative Speakers;” t(8) = 2.00, p = 0.08, for “Tolerance for Controversial Liberal Speakers.”
[8]t(8) = 4.52, p = 0.002.
[9]t(8) = 0.85, p = 0.42.
[10]t(8) = 0.32, p = 0.75.
[11]The Scholars Under Fire Database is available on FIRE’s website at https://www.thefire.org/research/publications/miscellaneous-publications/scholars-under-fire/.
[12]The Campus Disinvitation Database is available on FIRE’s website at https://www.thefire.org/research/disinvitation-database/.
[13]Differences are significant at the .05 level.
[14]Self-censorship was defined as the act of refraining from sharing certain views because you fear social (e.g., exclusion from social events), professional (e.g., losing a job or promotion), legal (e.g., prosecution or fine), or violent (e.g., assault) consequences, whether in-person or remotely (e.g., by phone or online), whether the feared consequences come from state or non-state sources.
[15]“None of the above” was also an option, and 17% of students selected this option.
[16]Differences are significant at the .05 level.
[17]Differences are significant at the .05 level.
[18]From 2020 to 2022 the topic asked about was “Transgender issues,” in 2023 the topic asked about was “Transgender rights.”
[19]In 2020 the topic asked about was “Race,” from 2021 to 2023 the topic asked about was “Racial inequality.”
[20]Gibson, J. (2006). Enigmas of intolerance: Fifty years after Stouffer’s Communism, Conformity, and Civil Liberties. Perspectives on Politics, 4, 21–34; Stouffer, S. A. (1955). Communism, conformity, and civil liberties: A cross-section of the nation speaks its mind. Transaction Publishers; Sullivan, J. L.; Piereson, J.; & Marcus, G. E. (1979). An alternative conceptualization of political tolerance: Illusory increases 1950s–1970s. American Political Science Review, 73, 781–794; Sullivan, J. L.; Piereson, J.; & Marcus, G. E. (1982). Political Tolerance and American Democracy. University of Chicago Press.
[21]Differences are significant at the .05 level.
[22]The differences for the remaining three speakers were not statistically significant.
[23]Differences are all significant at the .05 level.
[24]Differences are all significant at the .05 level.
[25]The Scholars Under Fire Database is on FIRE’s website at https://www.thefire.org/research/scholars-under-fire-database/.
[26]The Campus Disinvitation Database is available on FIRE’s website at https://www.thefire.org/research/disinvitation-database/.
[27]The Scholars Under Fire Database is on FIRE’s website at https://www.thefire.org/research/publications/miscellaneous-publications/scholars-under-fire/.
[28]The Campus Disinvitation Database is on FIRE’s website at https://www.thefire.org/research/disinvitation-database/.
[29]The Spotlight Database is on FIRE’s website at https://www.thefire.org/resources/spotlight/.